


DAX 30 and FTSE 100 Price Outlook
Have you seen our newest trading guides for USD, EUR and Gold ? Download for free latest forecasts
DAX 30 and FTSE 100 Price Action
At the start of the week the FTSE 100 rallied and on Tuesday printed 7,730- its highest level in nearly 12 months. However, the price has slipped back since then and closed yesterday near the weekly opening price. On the other hand, the Dax 30 started this week poorly and fell yesterday to 12,046 – its lowest levels in two weeks.
Alongside this, the Relative Strength Index (RSI) Fell sharply from 69.5 to 55 on the FTSE 100 emphasizing the buyer’s loss of momentum. In turn, the oscillator crossed below 50 on the Dax 30 indicating to a possible start of a downtrend.
Just getting started? See our Beginners’ Guide for FX traders
FTSE 100 PRICE Daily CHART (Oct 20, 2018 – AUg 1, 2019) Zoomed OUT
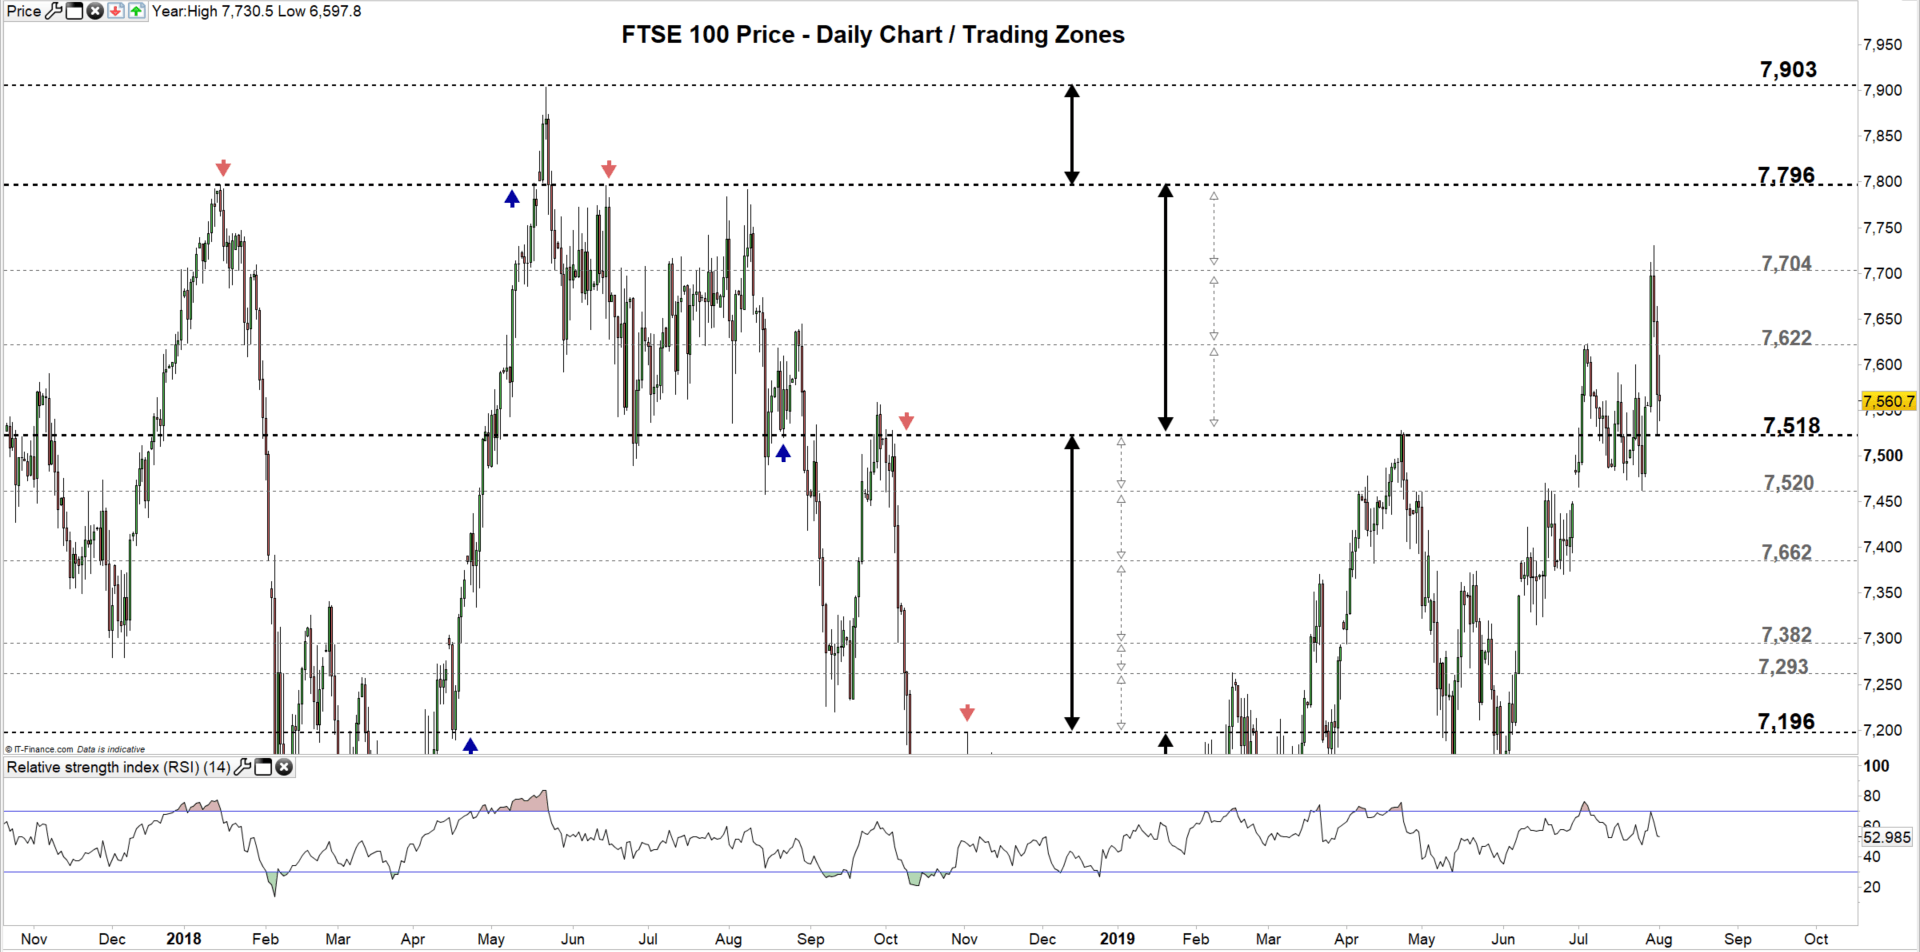
FTSE 100 PRICE Daily CHART (FEB 15 – Aug 1, 2019) Zoomed IN

Looking at the daily chart we notice yesterday the FTSE 100 moved to the lower trading zone 7,518 – 7,622. Hence, if the index closes below the low end of this zone, it may fall towards 7,520. However, the weekly support level marked on the chart should be kept in focus.
On the flipside, if the index closes above the high end of the current trading zone, this could lead the price towards 7,704. Nonetheless, the daily resistance levels marked on the chart (zoomed in) need to be watched along the way. See the chart to find out more about the significant resistance levels and zones in a further bullish scenario.
Having trouble with your trading strategy? Here’s the #1 Mistake That Traders Make
DAX 30 PRICE CHART (Aril 30, 2017 – Aug 1, 2019) Zoomed out

DAX 30 PRICE Daily CHART (May 15 – AUG 1, 2019) Zoomed IN
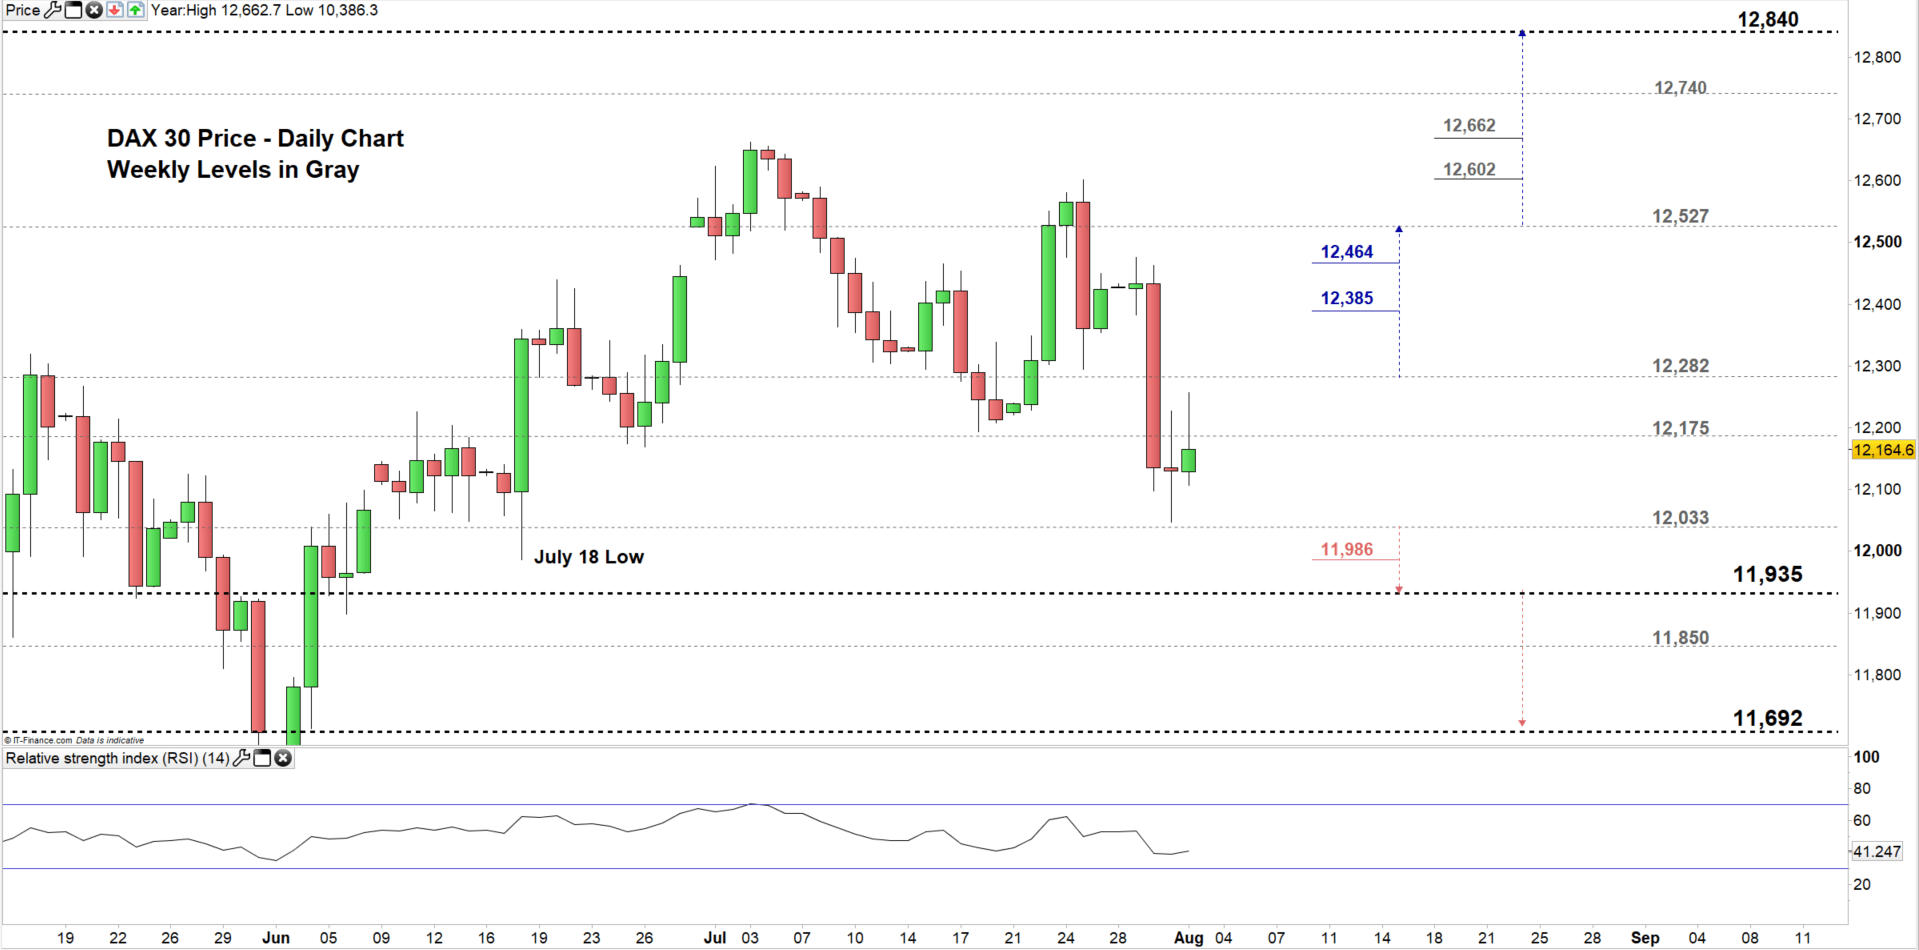
Looking at the daily chart we notice on Tuesday the Dax 30 moved to the lower trading zone 12,033 – 12,175. Yesterday, the index railed above the high end, however, slipped back after then closed below.
Therefore, a close above the high end may push the price towards 12,282 and further close above this level may cause a rally towards 12,527. Although, the daily resistance levels underlined on the chart (zoomed in) would be worth monitoring.
On the other hand, any close below the low end of the current trading zone may press the price towards 11,935. However, the July 18 low underscored on the chart (Zoomed in) needs to be considered. See the chart to know more about the lower trading zone and the weekly support level, the price would encounter in a further bearish scenario.
Written By: Mahmoud Alkudsi
Please feel free to contact me on Twitter: @Malkudsi


