


USD/SGD, USD/INR, USD/MYR, USD/PHP Talking Points
- USD/SGD may extend near-term uptrend to resistance
- USD/INR gains face more difficult technical barriers
- USD/MYR outlook biased little higher as PHP ranges
Trade all the major global economic data live as it populates in the economic calendar and follow live coverage for key events listed in the DailyFX Webinars. We’d love to have you along.
USD/SGD Technical Outlook
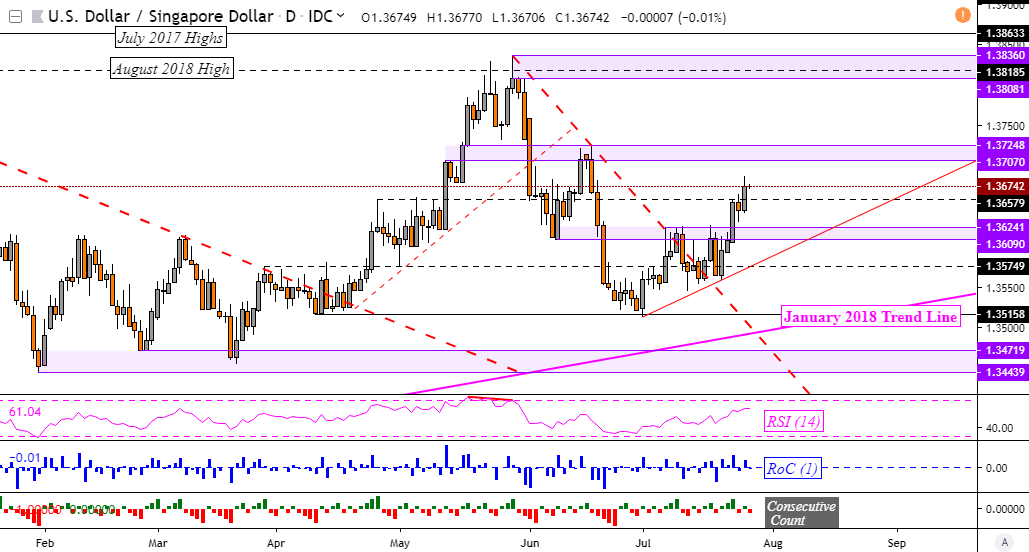
The US Dollar may extend its advance against the Singapore Dollar after taking out resistance at 1.3658, opening the door to testing the next psychological barrier between 1.3707 and 1.3725. This would be in-line with the uptrend since the beginning of July after the descending trend line from May was breached. On the other hand, turning lower has support eyed as a range between 1.3609 and 1.3624.
USD/SGD Daily Chart
USD/INR Technical Outlook
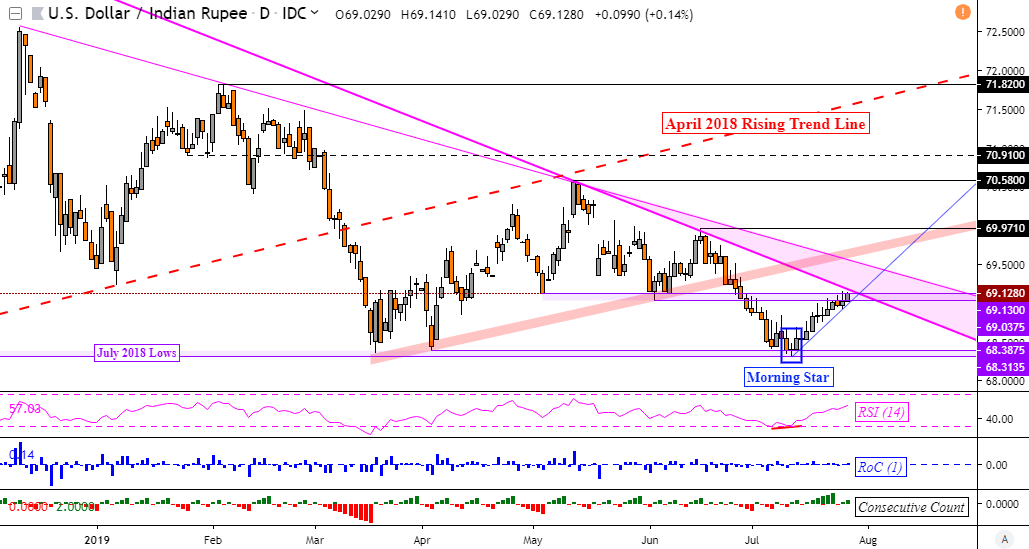
Against the Indian Rupee, the US Dollar faces a more difficult path. USD/INR sits right in a range of resistance between 69.04 and 69.13. Even if this is cleared, there remain the descending trend lines from December and October of 2018. I have outlined the difference between these two lines as a pink area on the chart below. Closing above these opens the door to overturning the dominant downtrend from last year.
USD/INR Daily Chart
USD/MYR Technical Outlook
Technical conditions in the Malaysian Ringgit offer a slightly bearish outlook. USD/MYR closed above a near-term falling trend line from June after holding above support at 4.1070. This may result in a test of near-term resistance at 4.1250 which if cleared, opens the door to reaching what may be a potential falling trend line from late May. Otherwise, turning lower past support exposes 4.0950 – 4.0930.
USD/MYR Daily Chart

USD/PHP Technical Outlook
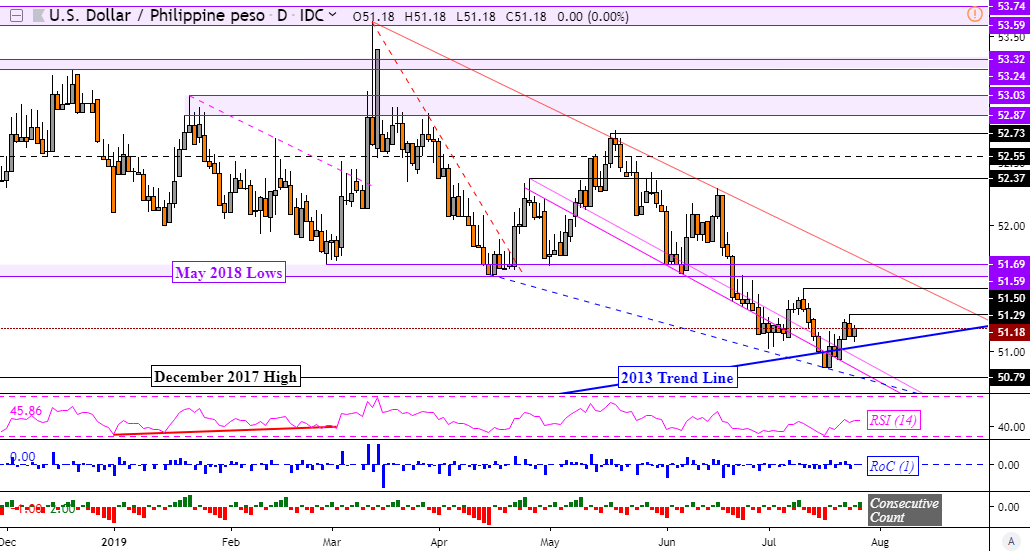
Meanwhile, USD/PHP is struggling to find direction as it hovers around a long-term trend line from 2013. If it ends up holding, we may see a resumption of Philippine Peso weakness that has defined its momentum for six years. Near-term resistance is at 51.29 followed by 51.50. For technical confirmation of a breakout lower, keep an eye on the December 2017 high at 50.79.
USD/PHP Daily Chart
**All Charts Created in TradingView
FX Trading Resources
- Just getting started? See our beginners’ guide for FX traders
- Having trouble with your strategy? Here’s the #1 mistake that traders make
- See how the US Dollar is viewed by the trading community at the DailyFX Sentiment Page
--- Written by Daniel Dubrovsky, Currency Analyst for DailyFX.com
To contact Daniel, use the comments section below or @ddubrovskyFX on Twitter


