


Copper Price Forecast
- Copper chart and analysis.
- Copper’s price action.
Did you check our latest forecasts on USD and Gold? Find out more for free from our Q3 forecasts for commodities and main currencies
Copper Price – The buyers Indecisive Intention
On July 9, Copper rebounded from $5,792 failing for the third time in testing its yearly support. The price also has been creating higher lows indicating to a potential uptrend may start after breaking above the July 1 high at 6,075.
Alongside this the Relative strength index (RSI) rose from 37 and crossed above 50 however, remained flat highlighting the buyer’s intention to start uptrend momentum, yet not decisive.
Having trouble with your trading strategy? Here’s the #1 Mistake That Traders Make
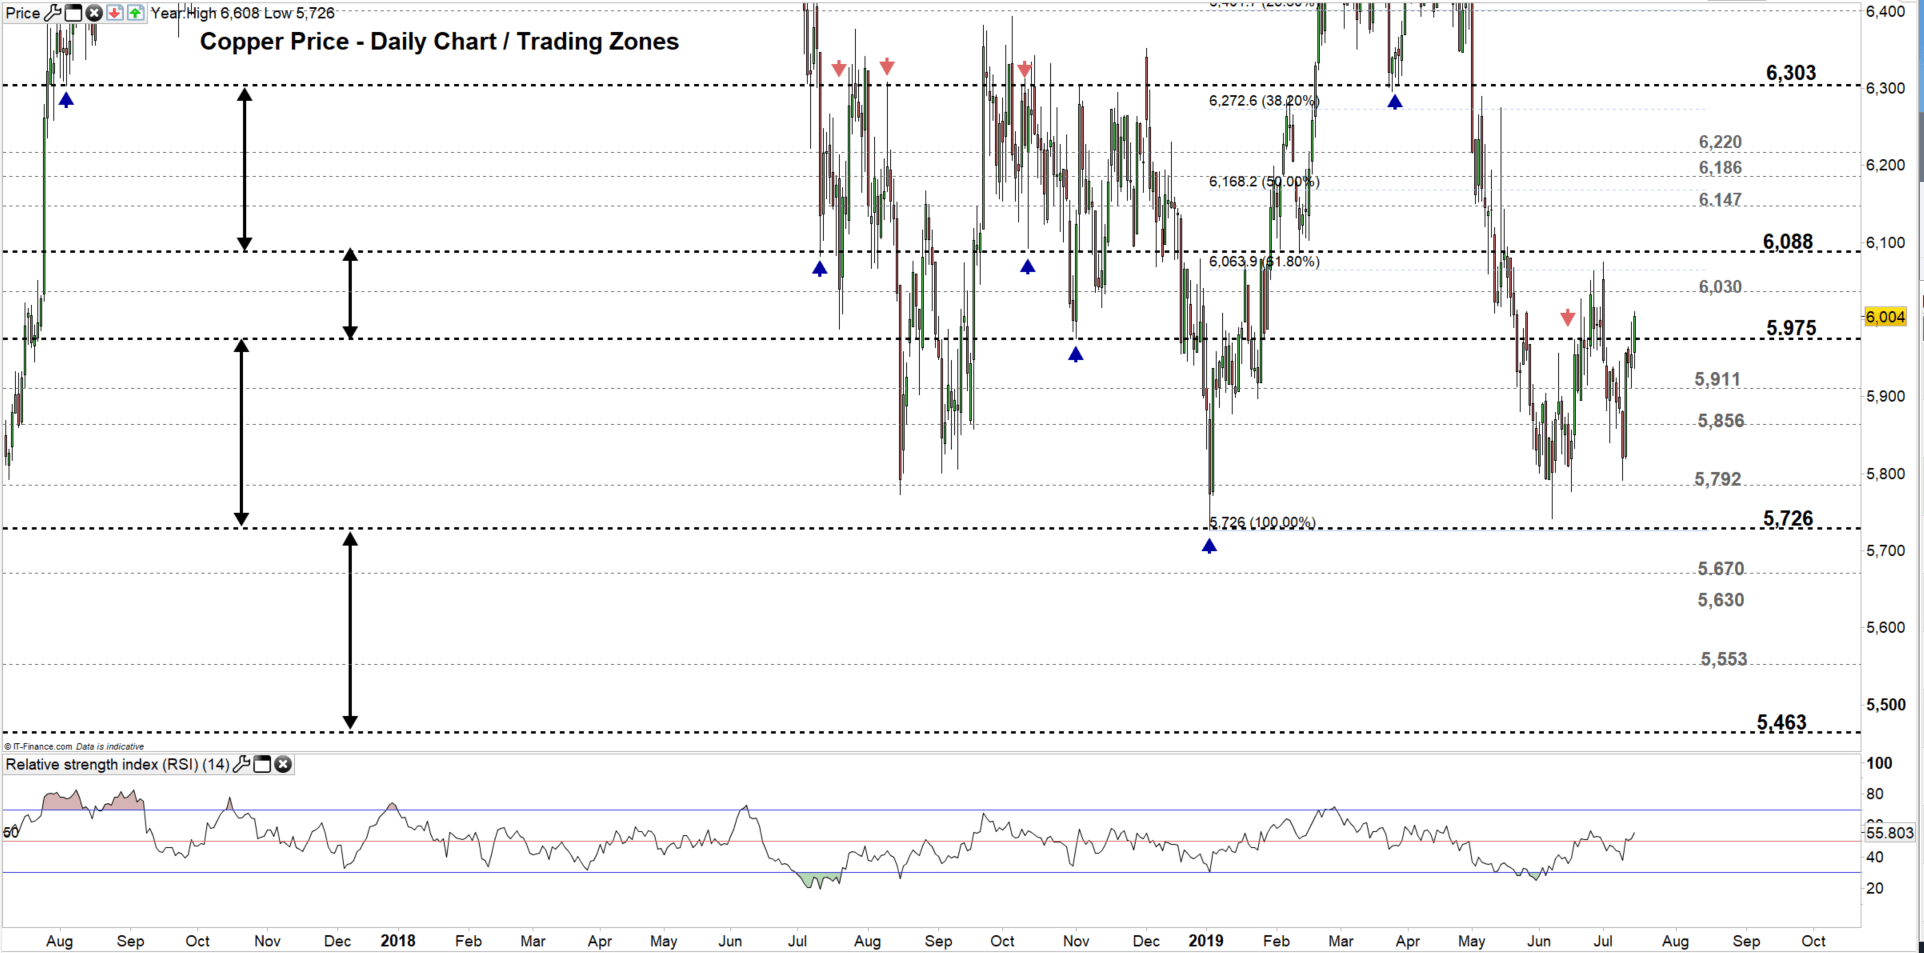
Copper DAILY PRICE CHART (July 15, 2017 – JUly 15, 2019) Zoomed out
Copper DAILY PRICE CHART (Mar 21 – JULY 15, 2019) Zoomed In
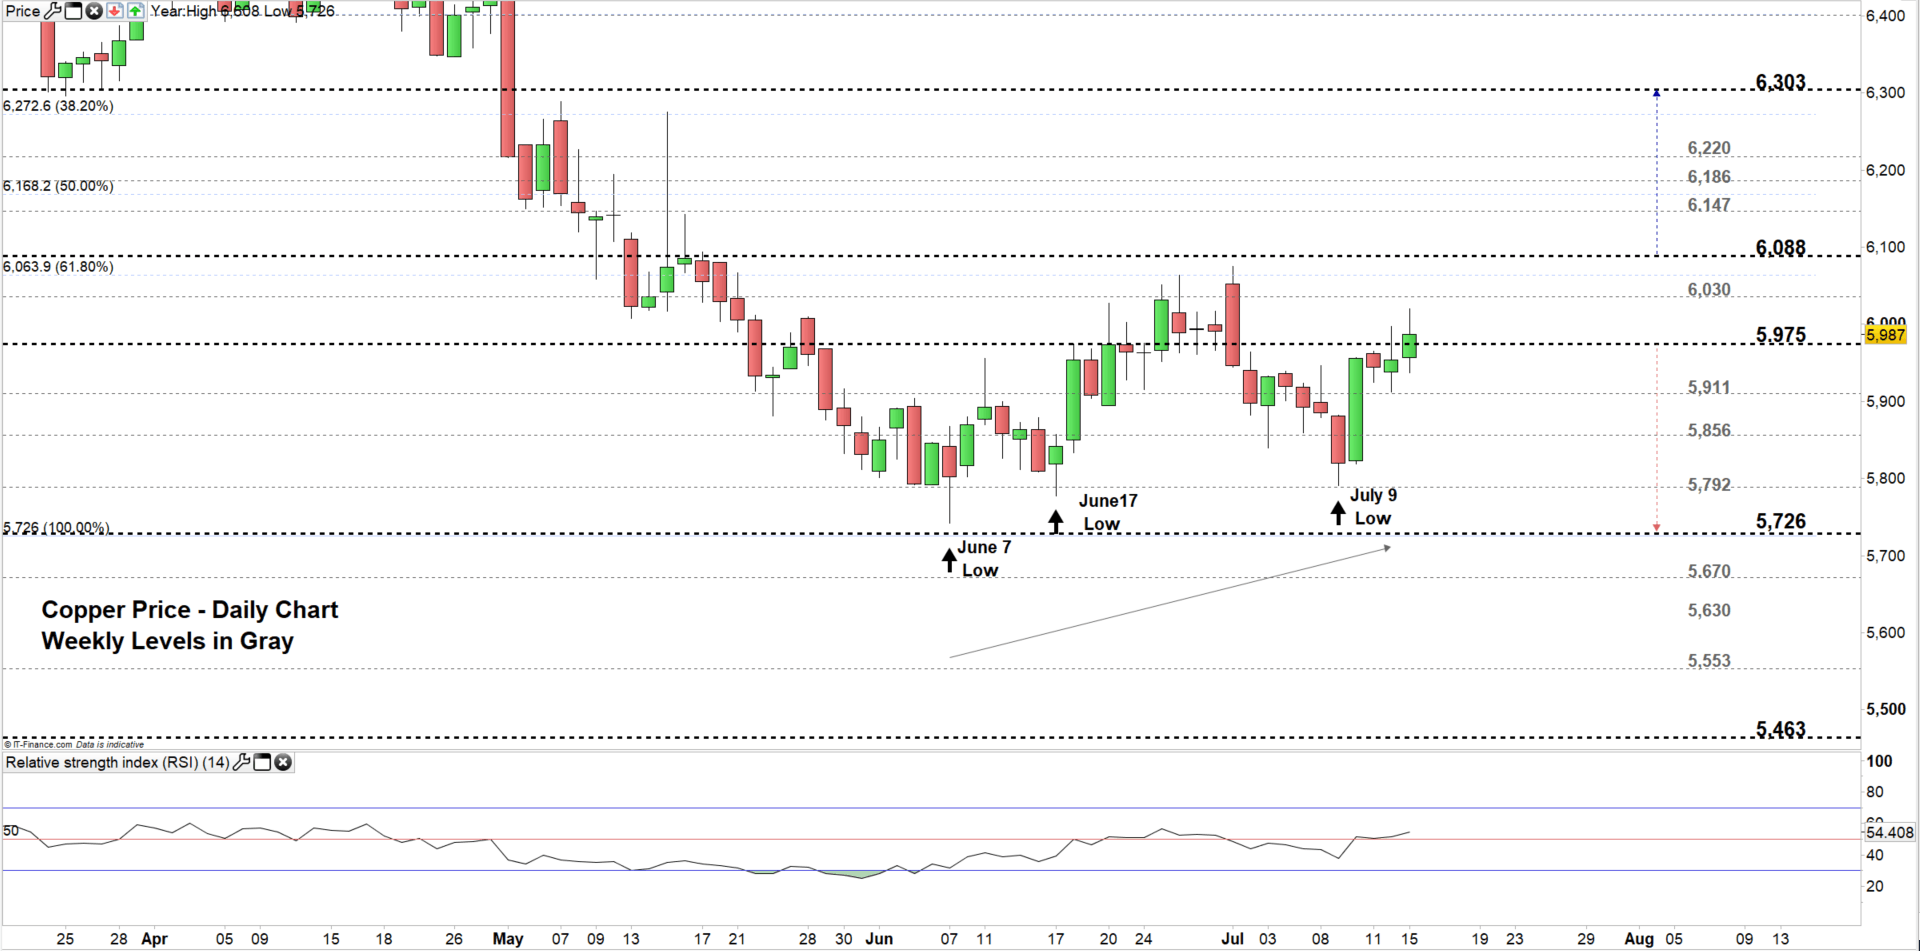
Looking at the daily chart we notice on July 12 Copper rallied for a test of $5,975, nonetheless the price failed to close above on Friday. Therefore, a close above this level could cause the price to rally towards $6,088 however, the weekly resistance marked on the chart (zoomed in) needs to be kept in focus
Further bullishness may require a close above $6,088. See the chart to learn more about the following trading zone and key levels in this scenario.
In turn, any failure to close above $5,975 could embolden the sellers to press the price towards $5,911. If Copper closes below this level this could send the price towards the July 9 low mentioned above although, the weekly support at $5,856 should be watched closely.
Just getting started? See our Beginners’ Guide for FX traders
CoPper Four-HOUR PRICE CHART (June 28 - JULy 15, 2019)

Looking at the four-hour chart, we notice today Copper opened with an upward gap, then rallied eyeing $6,030 therefore, a break above this level could send the price towards the July 1 high at $6,075 however, the daily resistance at 61.8% Fibonacci retracement at $6.063. See the chart to find out more about the next significant level buyers would encounter if the rally continues.
On the flip-side, a break below the daily support at $5,924 could press the price towards $5,879 contingent on clearing the weekly support at the July 12 low $5,912/11. See the chart for to know more about the next key level sellers would face if the selloff carries on.
Written By: Mahmoud Alkudsi
Please feel free to contact me on Twitter: @Malkud


