


Copper Price Forecast
- Copper chart and analysis.
- Copper’s price may be on its way to test its lowest price in over six months.
Did you check our latest forecasts on USD and Gold? Find out more for free from our Q3 forecasts for commodities and main currencies
Copper Price – Sellers in Charge
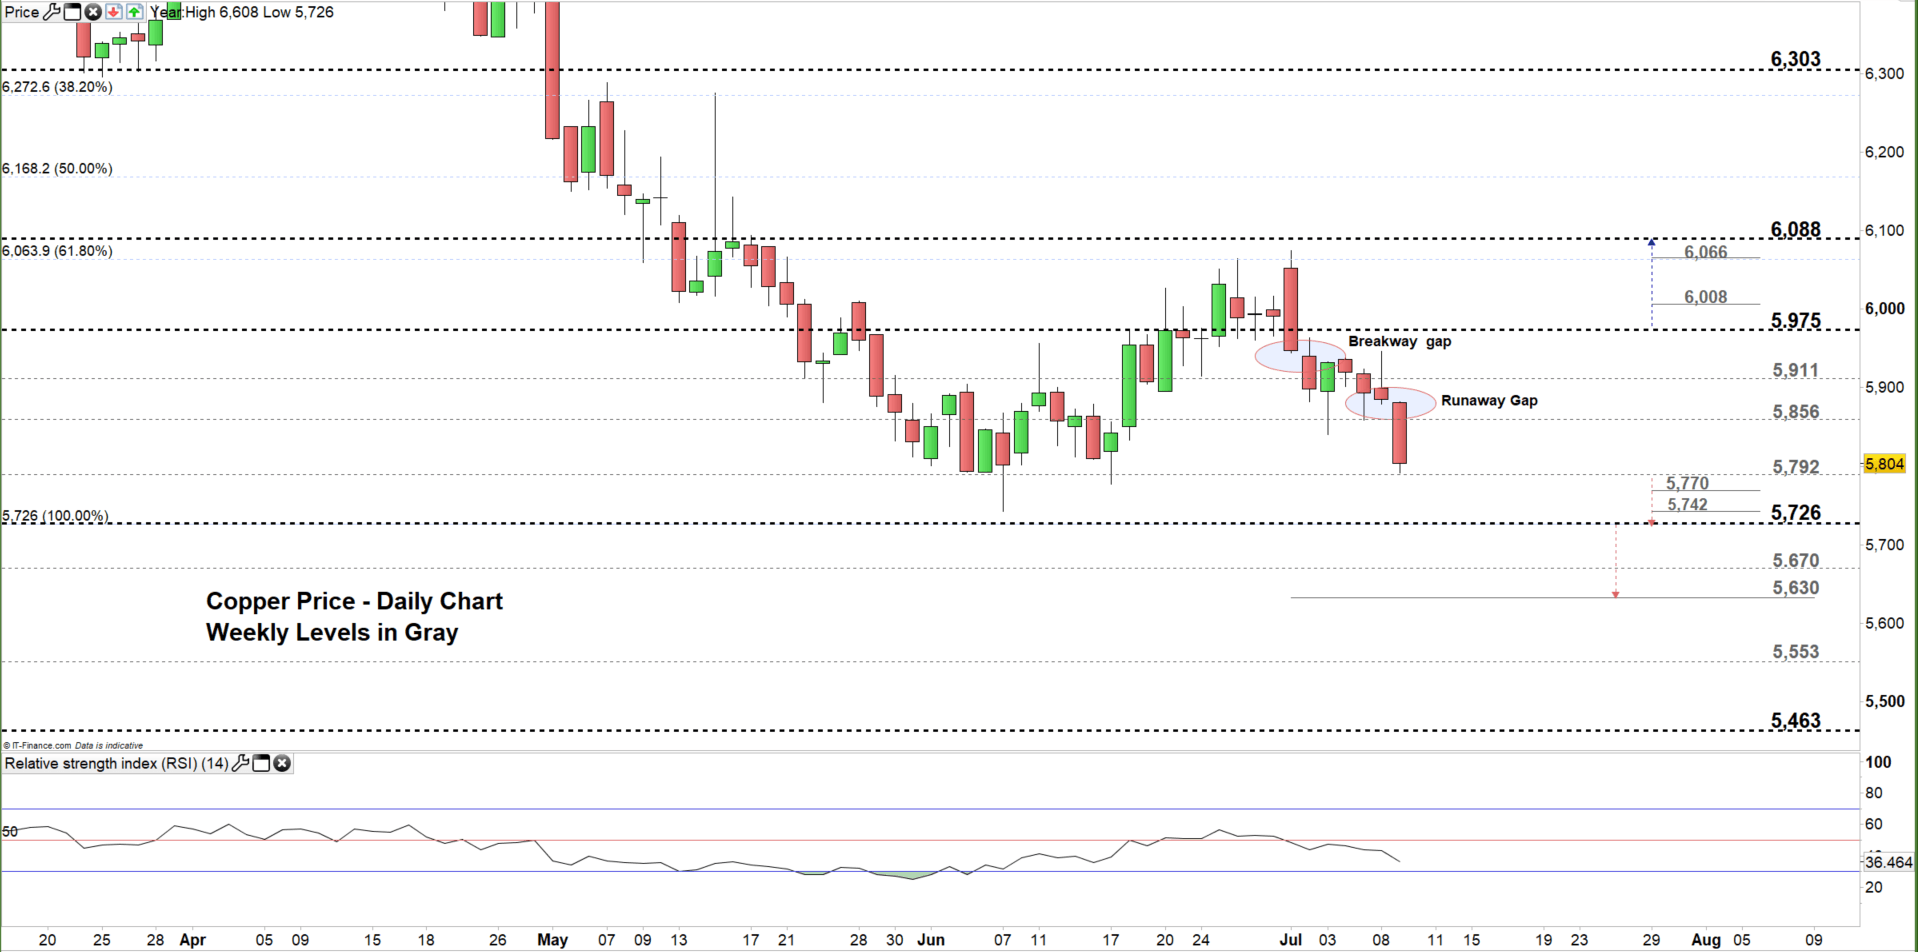
On July 2, Copper opened with a breakaway gap at $5,940, indicating to a possible start of a downtrend. Today, the price opened with a runaway gap at $5,881 highlighting the sellers are still dominating.
On Wednesday, the Relative Strength Index (RSI) U- turned before testing 50. Today, the oscillator is at 36 nearby the oversold territory indicating to strength of the bearish momentum.
Having trouble with your trading strategy? Here’s the #1 Mistake That Traders Make
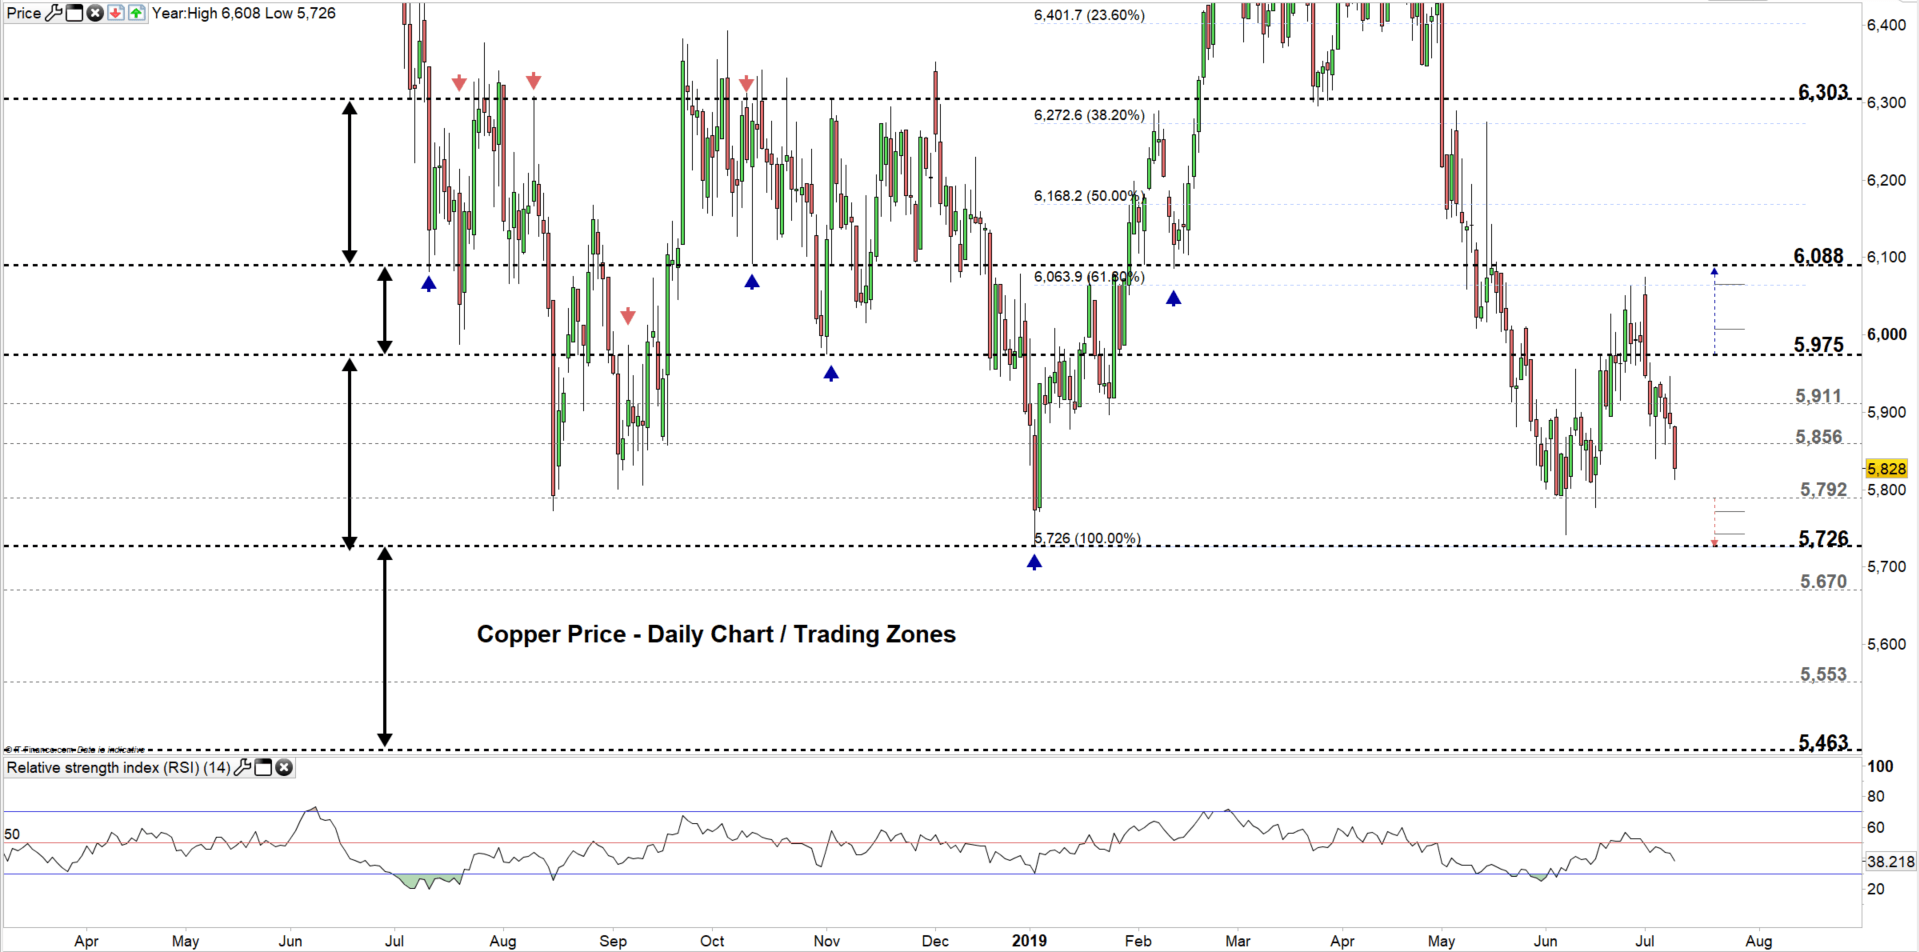
Copper DAILY PRICE CHART (July 4, 2018 – JUly 9, 2019) Zoomed out
Copper DAILY PRICE CHART (Mar 27 – JULY 9, 2019) Zoomed In
Looking at the daily chart we notice on last Monday Copper broke below the neck line of the double top pattern neck line discussed at the last week update at $5,961.
Yesterday, the price showed more weakness after closing with a bearish Doji pattern. Therefore, a close below $5,792 might see the price trading towards its lowest level printed this year at $5,726. Further close below this level could pave the way towards 5,630, nonetheless, the weekly support levels underlined on the chart (zoomed in) should be watched along the way.
On the flip-side, a close above $5,975 could cause a rally towards $6,088, although; the weekly resistance levels highlighted on the chart need to be kept in focus.
Just getting started? See our Beginners’ Guide for FX traders
CoPper Four-HOUR PRICE CHART (June 10- JULy 9, 2019)
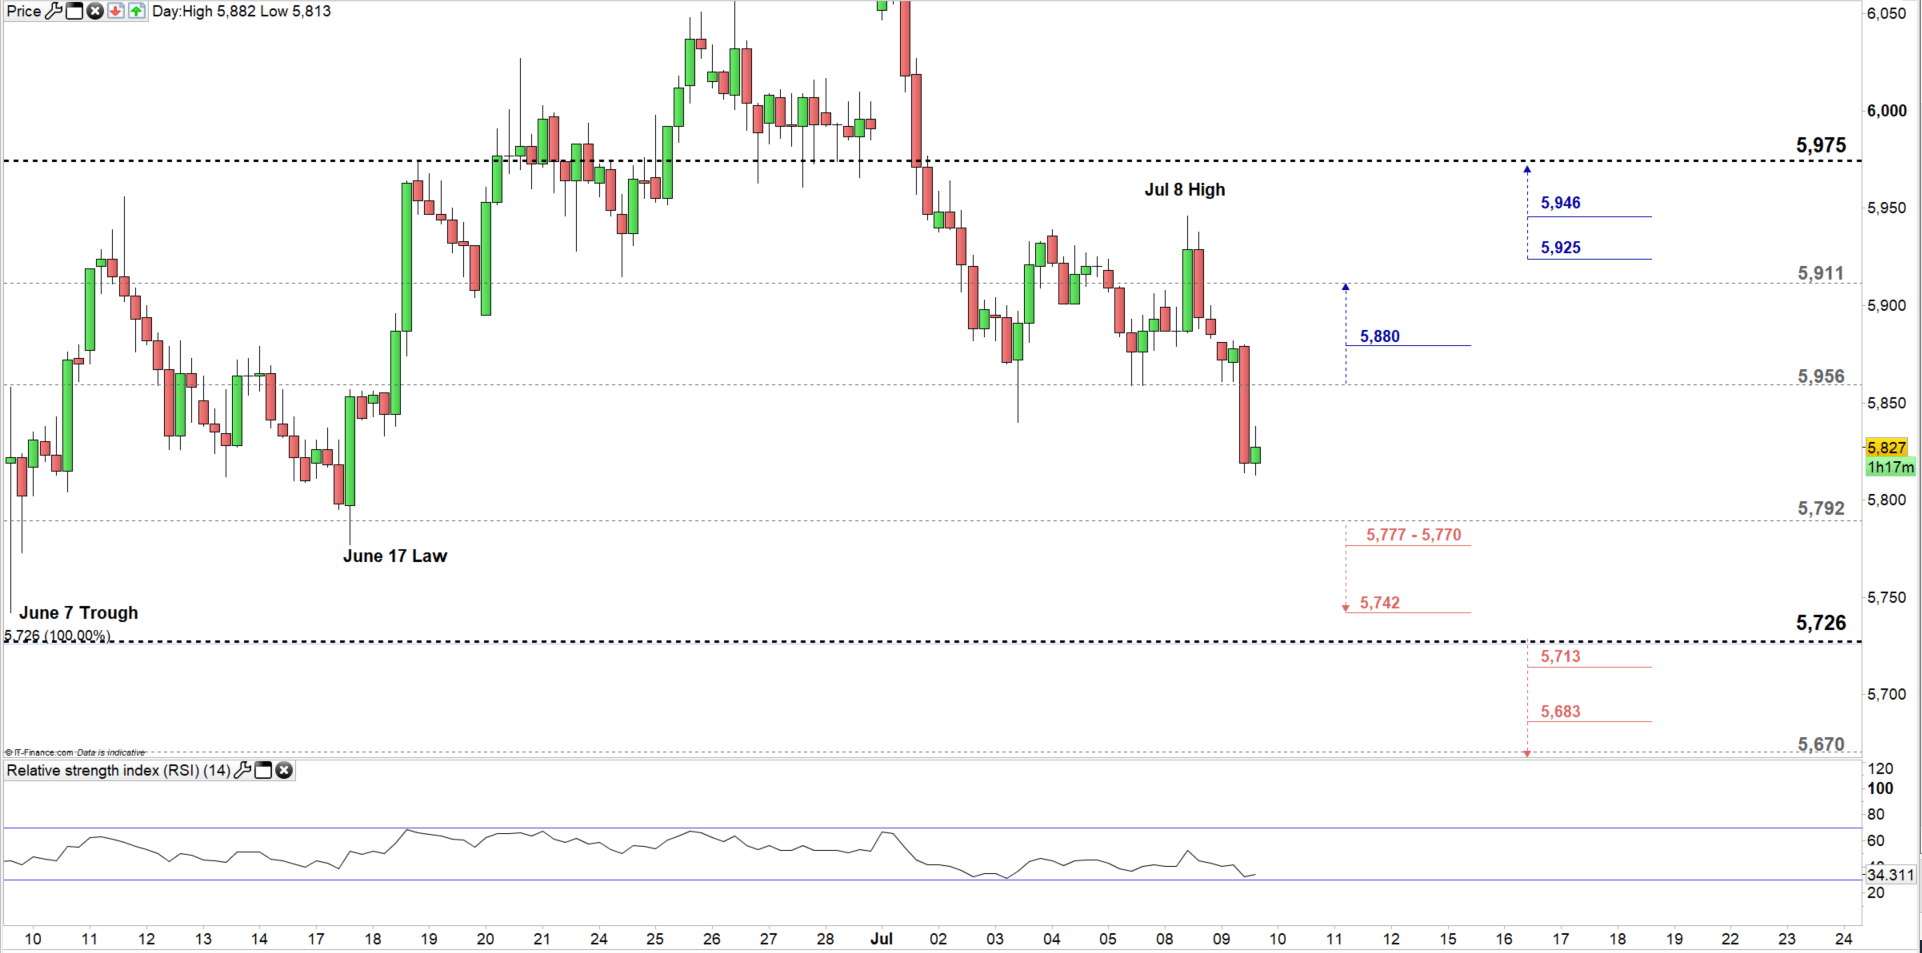
Looking at the four-hour chart, we notice yesterday Copper rallied towards $5,946 then reversed its move losing all daily profits. Today, the price continued its fall moving to a lower trading zone $5,792 - $5,956 eyeing a test of the low end.
A break below the low end might send the price to test its yearly support at $5,726, contingent on clearing the weekly support levels marked on the chart. See the chart to know more about the key levels if Copper probs two- year low.
In turn, a break above the high end of the aforementioned trading zone could cause a rally towards $5,911, however; the daily resistance at $5,880 needs to be considered. See the chart to find out more about the next significant resistance levels if the rally continued above mentioned levels.
Written By: Mahmoud Alkudsi
Please feel free to contact me on Twitter: @Malkud


