


Technical Highlights:
- Gold price broke out of multi-year wedge, suggest big rally
- Crude oil lacking some clarity, watch risk trends
- US Dollar broken wedge points to 2011 trend-line
- S&P 500 could find opposition again in second-half
Check out the intermediate-term market forecasts and educational content on the Trading Guides page.
Gold price broke out of multi-year wedge, suggest big rally
Since 2014 price swings in gold had become increasingly smaller, and with that volatility dropped to extremely low long-term levels. That period of low volatility looks to have ended with the recent breakout from the multi-year wedge.
The weekly breakout on the week ending June 21 put the price of gold firmly outside of the wedge and above highs going back several years. Looking at the size and duration of the pattern the move should equate to over $300, giving gold a measured move target of $1650-1700.
This will of course take time, but as long as we don’t see a move back inside the wedge the broader path of least resistance should remain up. Given the extended move to end last quarter we may see some backing-and-filling, possibly a retest of the zone in the 1340/60s before moving higher. A break back inside the wedge would revert a bullish outlook to neutral.
Gold Price Weekly Chart (BIG breakout)

To see the intermediate-term fundamental and technical outlook for Bullion, check out the Q3 Gold Forecast.
Crude oil lacking some clarity, watch risk trends
Crude oil doesn’t have the greatest technical clarity at this time. Risk trends and geopolitical developments will continue to be big drivers.
If stocks remain firm in the second-half, and that is a big ‘if’, then oil is likely to hold up and could even further a rally up to the 2008 trend-line. However, if we see stocks drop materially then pressure is likely to push oil lower and put pressure on the slope running over from July 2016 and the trend-line off the February 2016 low. At this time, those lines are in confluence near $47. A break below there could lead to considerable weakness.
Crude oil Weekly Chart (direction a little unclear, big support down below)

See what drivers and technical factors are expected to move oil in the coming months in the Q3 Crude Oil Forecast.
US Dollar broken wedge points to 2011 trend-line
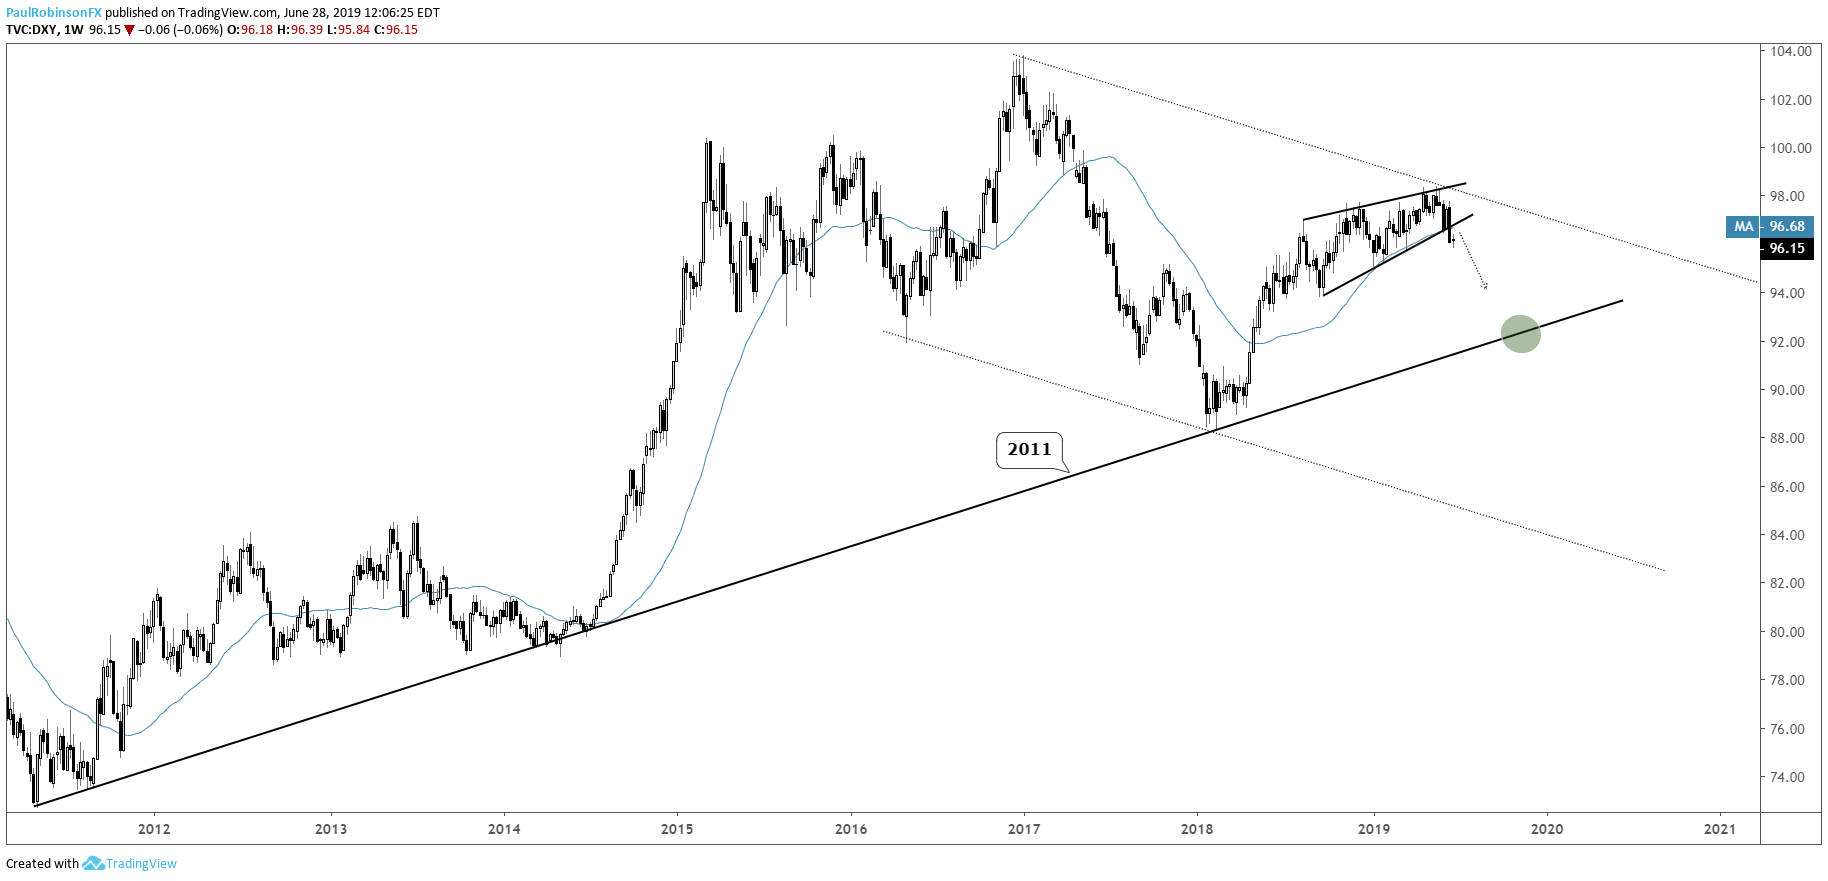
The US Dollar Index (DXY) broke a rising wedge formation a couple of weeks back, which gives the Dollar big downside potential. There are short-term support levels to watch along the way, 95.03, 93.81 are a couple of the more meaningful levels, but the broader target is for a move to the 2011 trend-line currently down in the 92s. To negate the bearish break a recovery beyond the year high at 98.37 will be needed.
US Dollar Index (DXY) Weekly Chart (Broke Wedge, Eyeing 2011 t-line)
The US Dollar didn’t move much during the last quarter of 2018, check out what could make that change in Q3 USD Forecast.
S&P 500 could find opposition again in second-half
It’s been hard being a bear in stocks, but another swoon could come soon off record levels again as we’ve seen twice since the beginning of 2018. There is a broad Reverse Symmetrical Triangle pattern (RST) in the works, with its higher-highs and lower-lows marking growing instability in the bull market since the 2009 low. If the pattern comes to exert full bearish potential, then it would end in a much larger than sell-off than anything we’ve seen since 2008.
Even if the pattern doesn’t bring an extreme down-move, the market hasn’t been kind to those who pay up for breakouts to new highs, and it is reasonable to conclude that we could see another downdraft of some type in the coming months. Watch the top-side trend-line from January 2018, it is in confluence with the psychological level of 3k; this would be a good spot for a top to form.
Also, it’s worth continuing to pay attention to the Russell 2000, as it is severely lagging the broader market. As an index consisting of higher beta stocks it is showing that risk appetite isn’t particularly strong even if the major indices are trading at or around record levels.
FAANG has also been a laggard, but to a lesser degree; this group of bull market darlings (Facebook, Apple, Amazon, Netflix, and Google) could also be showing cracks in investor sentiment. Keep an eye out especially for Google which had a ‘hole-in-the-wall’ type breakaway gap on its last earnings announcement; it has a similar look to Facebook last July before the broader market topped in September.
S&P 500 Weekly Chart (Broke Wedge, Eyeing 2011 t-line)

With global stocks having rebounded, see where our analysts see stocks headed in the Q3 Equities Forecast.
Tools for Forex & CFD Traders
Whether you are a beginning or experienced trader, DailyFX has several resources available to help you; indicator for tracking trader sentiment, quarterly trading forecasts, analytical and educational webinars held daily, trading guides to help you improve trading performance, and one specifically for those who are new to forex.
---Written by Paul Robinson, Market Analyst
You can follow Paul on Twitter at @PaulRobinsonFX


