


Dow Jones Talking Points:
- The bullish Q1 theme in the Dow has come under fire in the month of March, amidst a backdrop of seemingly positive items with the Fed’s dovish shift and the ‘golden cross’ on the daily chart that showed up last week.
- Prices in the Dow have spent the month of March showing resistance at lower-highs, but buyers haven’t yet abandoned the matter as this has been coupled with higher-lows. This makes for a symmetrical wedge pattern building throughout the month; but when taken with context of the prior two months, this presents a bull pennant formation that can incorporate a directional bias into that symmetrical wedge. It also offers a fairly clear-cut line-in-the-sand for invalidation, taken from the March swing low at an ‘s3’ zone of support identified earlier this month.
- DailyFX Forecasts on a variety of currencies such as the US Dollar or the Euro are available from the DailyFX Trading Guides page. If you’re looking to improve your trading approach, check out Traits of Successful Traders. And if you’re looking for an introductory primer to the Forex market, check out our New to FX Guide.
The bullish Q1 theme from the Dow has taken pause over the past month, and this took place as the Federal Reserve took a step back on rate hike expectations, which would generally be considered a positive driver for the risk trade. And that took place after what many media outlets consider to be a bullish technical observation with a ‘golden cross’ formation that appeared last week.
While the FOMC’s pledges towards further rate hikes in Q4 of last year helped to reverse US equities, the continued softening at the Federal Reserve from December and into January and February helped to arrest those declines, allowing for the Dow and S&P 500 to re-ascend towards prior highs. But as the calendar flipped into March and as prices in the Dow approached the November high, matters began to turn and that plot thickened through early-March trade.
At this point, the Dow Jones Industrial Average has been making a series of lower-highs throughout this month, and this is coupled with a series of higher-lows, making for a symmetrical wedge pattern.
DJIA: Dow Jones Four-Hour Price Chart

Chart prepared by James Stanley
Taking a step back to the Daily chart, and that symmetrical wedge after two months of bullish rip presents a bull pennant pattern, which will often give some element of bias potential to the symmetrical wedge which, in and of itself, doesn’t carry much for directional appeal.
Bull pennants can keep the door open to bullish continuation potential, and they also present a rather clear-cut area of invalidation given the context around the Dow Jones at the moment. The March swing-low built-in off of a key area on the chart, an ‘s3’ zone that was looked at in these technical pieces earlier this month. That price is derived from the 14.4% Fibonacci retracement of the August 2015 – October 2018 major move; and if prices break-below that level, the bullish theme in the Dow will come under question and the prospect of bearish reversals can grow more attractive as the door opens into Q2.
Dow Jones Daily Price Chart
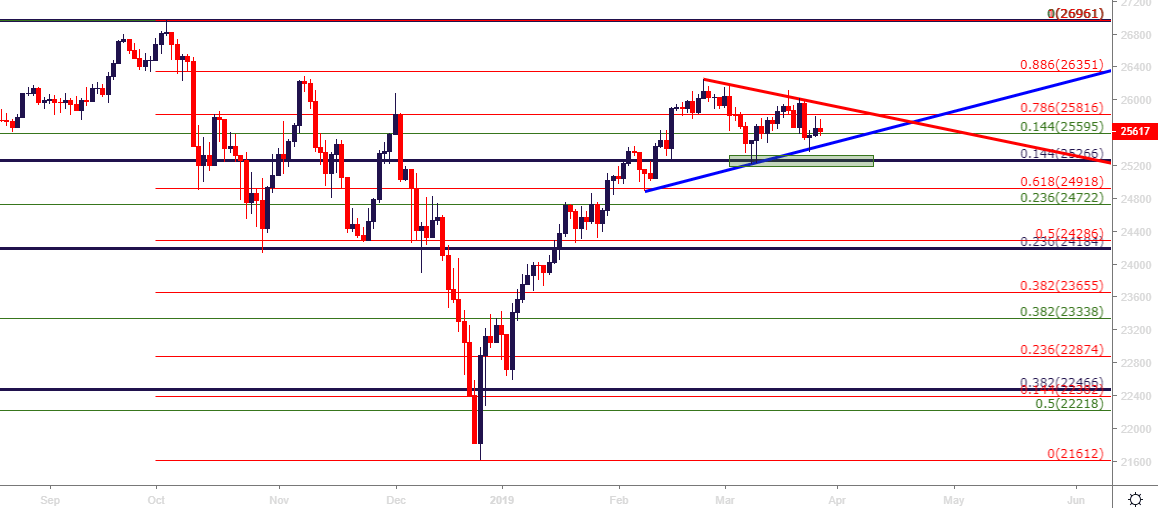
Chart prepared by James Stanley
You may also be interested in:
Day Trading the Dow Jones: Strategies, Tips & Trading Signals
To read more:
Are you looking for longer-term analysis on the U.S. Dollar? Our DailyFX Forecasts have a section for each major currency, and we also offer a plethora of resources on USD-pairs such as EUR/USD, GBP/USD, USD/JPY, AUD/USD. Traders can also stay up with near-term positioning via our IG Client Sentiment Indicator.
Forex Trading Resources
DailyFX offers a plethora of tools, indicators and resources to help traders. For those looking for trading ideas, our IG Client Sentiment shows the positioning of retail traders with actual live trades and positions. Our trading guides bring our DailyFX Quarterly Forecasts and our Top Trading Opportunities; and our real-time news feed has intra-day interactions from the DailyFX team. And if you’re looking for real-time analysis, our DailyFX Webinars offer numerous sessions each week in which you can see how and why we’re looking at what we’re looking at.
If you’re looking for educational information, our New to FX guide is there to help new(er) traders while our Traits of Successful Traders research is built to help sharpen the skill set by focusing on risk and trade management.
--- Written by James Stanley, Strategist for DailyFX.com
Contact and follow James on Twitter: @JStanleyFX


