


Dow Jones Talking Points:
- Equity rallies have driven US stocks up to fresh two-month-highs, and the Dow is now testing the 88.6% Fibonacci retracement of the December sell-off.
- That retracement aligns closely with another level of interest, as taken from the 14.4% Fibonacci retracement of the post-Election run in the index. This is the resistance zone looked at last week, and now that prices are there – can bulls continue to push?
- DailyFX Forecasts on a variety of currencies such as the US Dollar or the Euro are available from the DailyFX Trading Guides page. If you’re looking to improve your trading approach, check out Traits of Successful Traders. And if you’re looking for an introductory primer to the Forex market, check out our New to FX Guide.
Do you want to see how retail traders are currently trading the US Dollar? Check out our IG Client Sentiment Indicator.
Dow Recovery Drives to Fresh Two-Month Highs
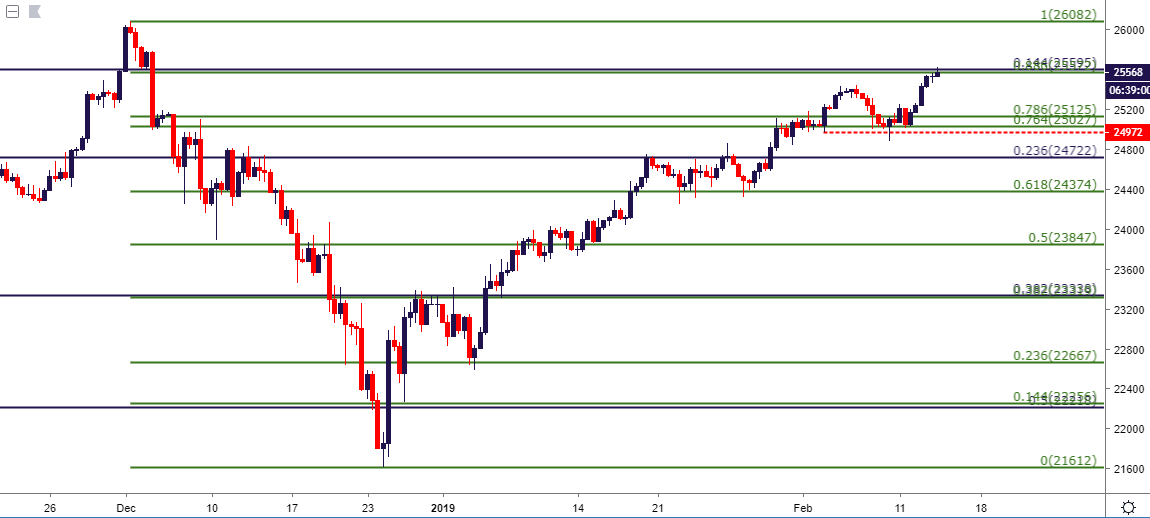
Matters can change on the turn-of-a-dime in financial markets, and one of the clearest current illustrations of this premise is price action in US stocks over the past few months. Doom-and-gloom showed up in Q4, and sellers remained in-control of US bourses for the bulk of the period. Prices in US equities bottomed-out around the Christmas holiday; but since then a far different tone has shown that’s seen a large portion of those prior losses erased.
At this point, prices in the Dow are now testing the 88.6% Fibonacci retracement of the December sell-off. This aligns very closely with another level of interest, as just a few points-higher is the 14.4% retracement of the post-Election run in the index. This denotes fresh two-month highs in the index, coming on the heels of last week’s pullback to find support around the 25k psychological level.
DJIA: Dow Jones Eight-Hour Price Chart
Near-Term Strategy in the Dow
At this point, equity bulls are likely going to want to implement patience in timing bullish approaches, as short-term dynamics in the Dow appear to be overbought as indicated by divergence in the RSI indicator on the hourly chart. This doesn’t necessarily denote the end of the bullish advance as much as the fact that a pause or pullback may be needed before buyers jump back-in to continue driving to fresh highs.
DJIA: Dow Jones Hourly Price Chart

On the support side of the index, a number of potential areas-of-interest remain, and this can be implemented based on how aggressively the trader wants to work with the topside trend in the index. The 25,400 area helped to cap last week’s highs, and a pullback from current levels to that spot would be rather shallow; but for those looking to remain aggressive with this theme, that scenario can remain of interest. A bit-lower is another potential support area on the chart, taken from 25,185-25,250. And a third possible support zone exists, running from the 23.6% marker of the post-Election move up to 24,857.
If bulls fail to hold the move above all three of the above-mentioned support zones, the near-term theme of equity strength would come into question.
DJIA: Dow Jones Four-Hour Price Chart
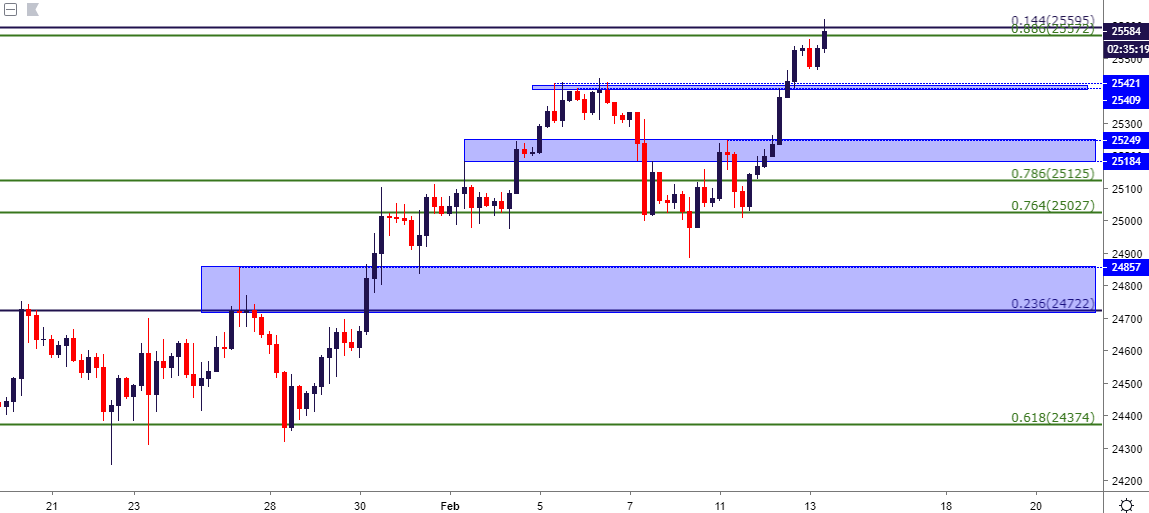
Chart prepared by James Stanley
You may also be interested in:
Day Trading the Dow Jones: Strategies, Tips & Trading Signals
To read more:
Are you looking for longer-term analysis on the U.S. Dollar? Our DailyFX Forecasts have a section for each major currency, and we also offer a plethora of resources on USD-pairs such as EUR/USD, GBP/USD, USD/JPY, AUD/USD. Traders can also stay up with near-term positioning via our IG Client Sentiment Indicator.
Forex Trading Resources
DailyFX offers a plethora of tools, indicators and resources to help traders. For those looking for trading ideas, our IG Client Sentiment shows the positioning of retail traders with actual live trades and positions. Our trading guides bring our DailyFX Quarterly Forecasts and our Top Trading Opportunities; and our real-time news feed has intra-day interactions from the DailyFX team. And if you’re looking for real-time analysis, our DailyFX Webinars offer numerous sessions each week in which you can see how and why we’re looking at what we’re looking at.
If you’re looking for educational information, our New to FX guide is there to help new(er) traders while our Traits of Successful Traders research is built to help sharpen the skill set by focusing on risk and trade management.
--- Written by James Stanley, Strategist for DailyFX.com
Contact and follow James on Twitter: @JStanleyFX


