


ASEAN Technical Outlook – USD/PHP, USD/SGD, USD/IDR, USD/MYR
- Indonesian Rupiah may fall against the US Dollar, USD/IDR clears trend line
- Fading downside momentum undermines declines in USD/MYR and USD/PHP
- USD/SGD falls under near-term rising support range, opening the door to fall
We released our Q1 forecasts for currencies like the US Dollar in the DailyFX Trading Guides page
USD/IDR Technical Analysis – Dominant Downtrend on Hold?
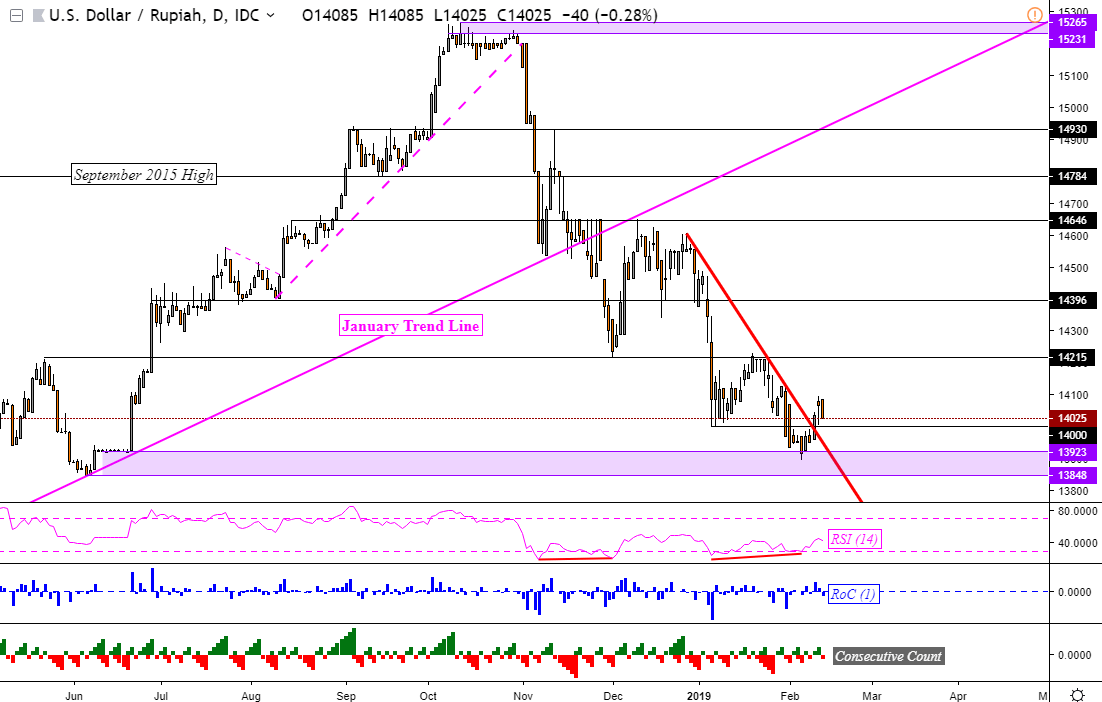
As anticipated, the US Dollar advanced against the Indonesian Rupiah from last week as support held around 13,923. Positive RSI divergence warned that downside momentum was fading, resulting in a close above a descending trend line from the beginning of this year. Additional closes above the resistance line perhaps offer the confirmation needed to argue that the USD/IDR may rise in the near-term.
From here, an ascent would place 14,215 as near-term resistance. Immediate support on the other hand is at 14,000. A close under that exposes the horizontal range of resistance that held last week. For updates on the ASEAN pairs that I am closely watching in the interim, you may follow me on Twitter @ddubrovskyFX.
USD/IDR Daily Chart
USD/MYR Technical Analysis – Downside Momentum Still Fading
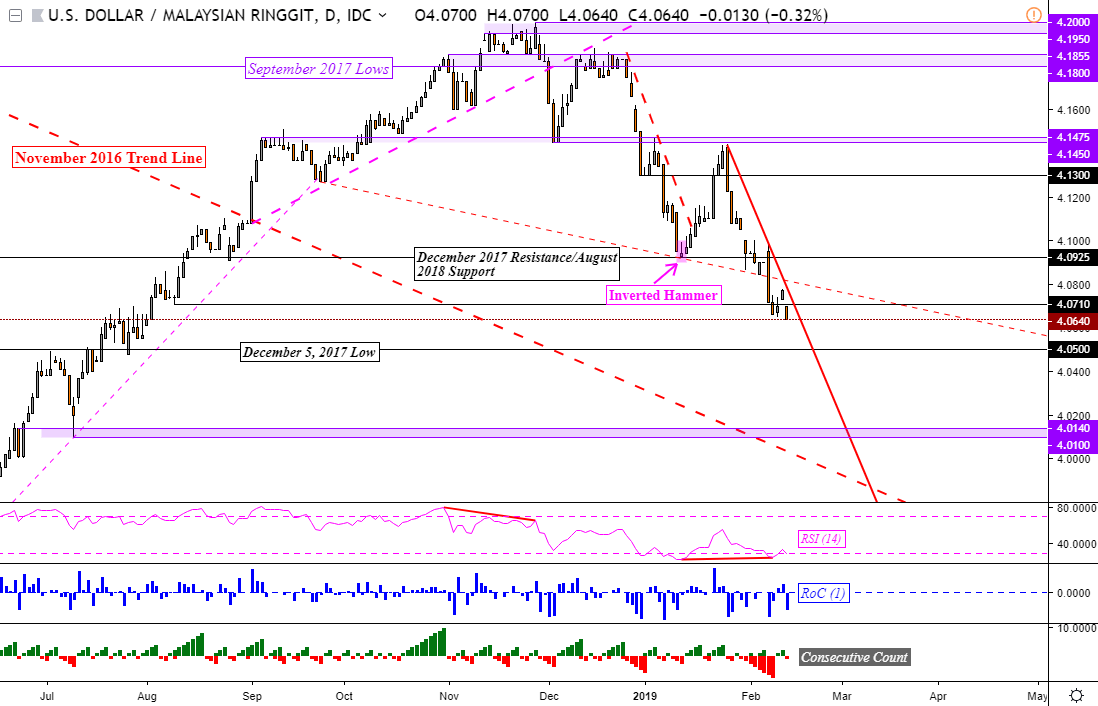
Sometimes fading downside momentum may not precede a bullish reversal, such was the case this past week in USD/MYR. The pair closed under a descending support line from September 2018 despite this warning signal. However, positive RSI divergence still appears on the daily chart below and should still warrant caution. Gains in the Malaysian Ringgit has exposed the December 5, 2017 low at 4.05. Immediate resistance appears to be a falling trend line from January.
USD/MYR Daily Chart
USD/SGD Technical Analysis – Near-term Uptrend Over?
The US Dollar made upside progress against the Singapore Dollar since we last looked at USD/SGD. A falling trend line from the end of last year was cleared. Resistance held thereafter as a horizontal range between 1.36118 and 1.36216. Prices have since turned lower, opening the door to declines in the days ahead.
USD/SGD Daily Chart

Zooming in on the 4-hour chart reveals that USD/SGD closed under a rising range of support, exposing the near-term falling trend line from January. It may hold next as new support. Falling through it may open the door to testing 1.34897 thereafter.
USD/SGD 4-Hour Chart

USD/PHP Technical Analysis – Will Critical Support Hold?
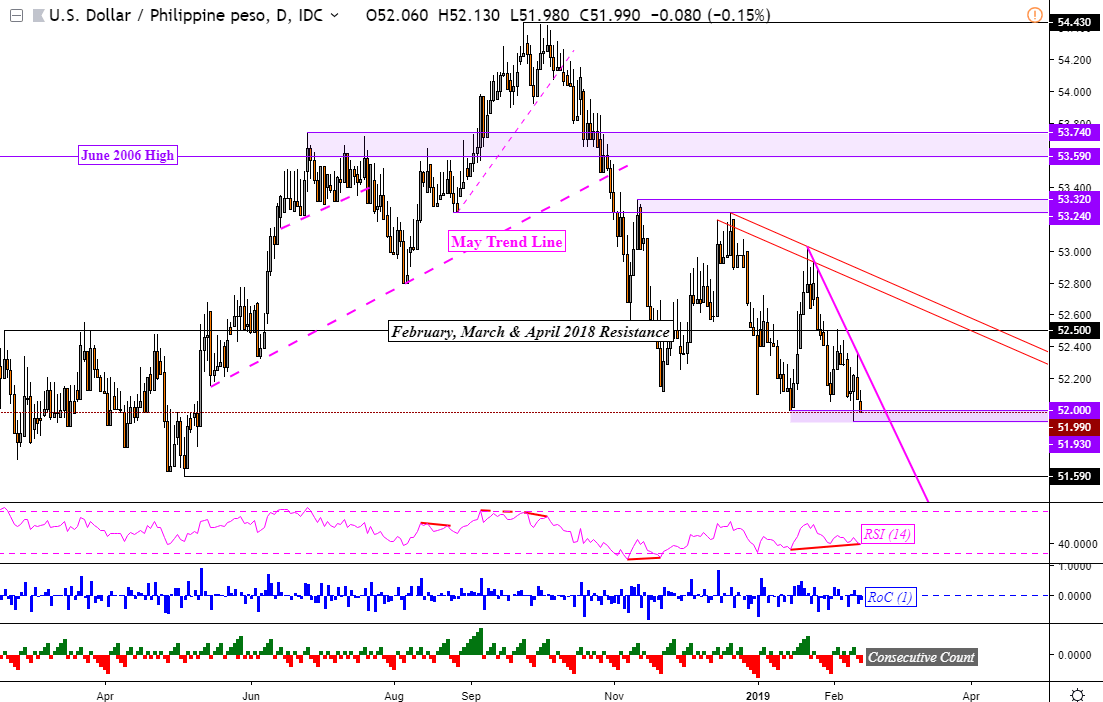
USD/PHP is testing a critical support range between 51.93 and 52.00. If cleared, the dominant downtrend from October 2018 may resume. Keep in mind that positive RSI divergence here also warns that downside momentum is ebbing, opening the door to a turn higher next. Weakness in the Philippine Peso would have USD/PHP eyeing a falling trend line from January (pink line on the chart below). Should support break on the other hand, 51.59 may be targeted next (April/May 2018 lows).
USD/PHP Daily Chart
**All Charts Created in TradingView
Read this week’s ASEAN fundamental outlook to learn about the underlying drivers for these currencies!
FX Trading Resources
- Just getting started? See our beginners’ guide for FX traders
- Having trouble with your strategy? Here’s the #1 mistake that traders make
- See how the US Dollar is viewed by the trading community at the DailyFX Sentiment Page
--- Written by Daniel Dubrovsky, Junior Currency Analyst for DailyFX.com
To contact Daniel, use the comments section below or @ddubrovskyFX on Twitter


