


ASEAN Technical Outlook – USD/PHP, USD/SGD, USD/IDR, USD/MYR
- US Dollar may gain against the Malaysian Ringgit, Indonesian Rupiah next
- USD/SGD neat-term uptrend facing multiple descending trend lines ahead
- Philippine Peso back at square one, support and resistance were reinforced
We released our Q1 forecasts for currencies like the US Dollar in the DailyFX Trading Guides page
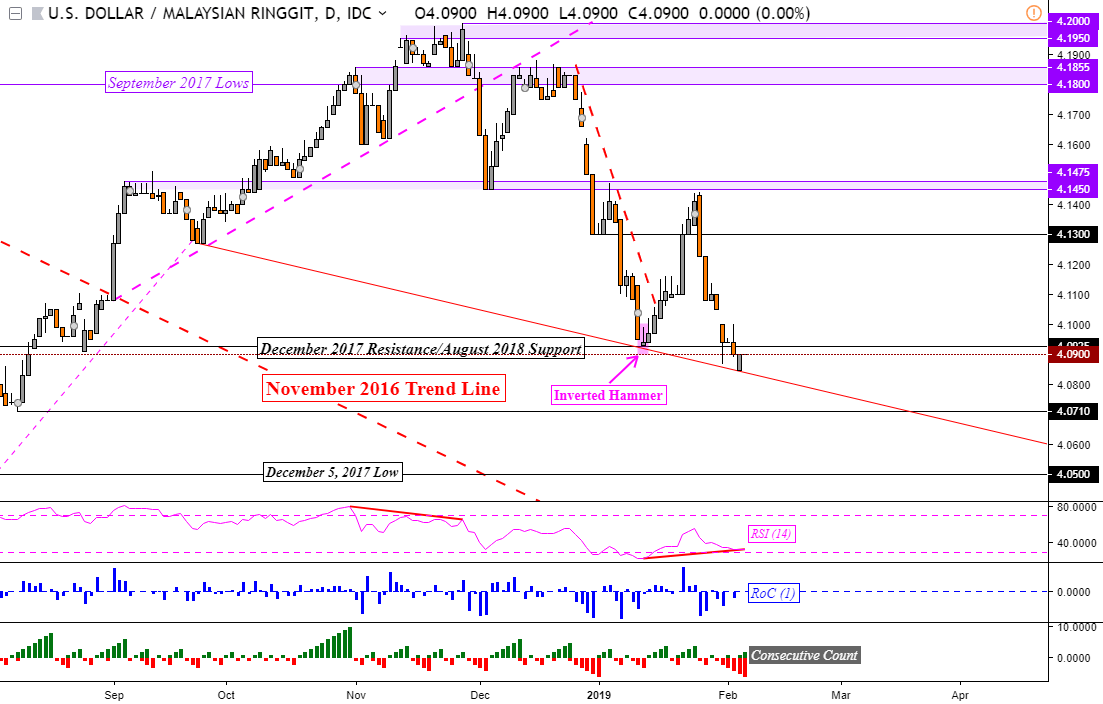
USD/MYR Technical Analysis – Downside Momentum Fading
The Malaysian Ringgit is attempting to extend gains against the US Dollar since USD/MYR resumed the dominant downtrend from November 2018. Its temporary uptrend during the middle of January was launched after an inverted hammer as expected. Resistance then held at 4.1450 and now the pair finds itself sitting right above a descending trend line from September.
Positive RSI divergence does warn that downside momentum is ebbing and it may precede a turn higher in the near-term. This would place immediate resistance at 4.0925 which if broken, could open the door to a climb towards 4.1300. On the other hand, resumption of the downtrend would place the next area of support at 4.0710.
USD/MYR Daily Chart
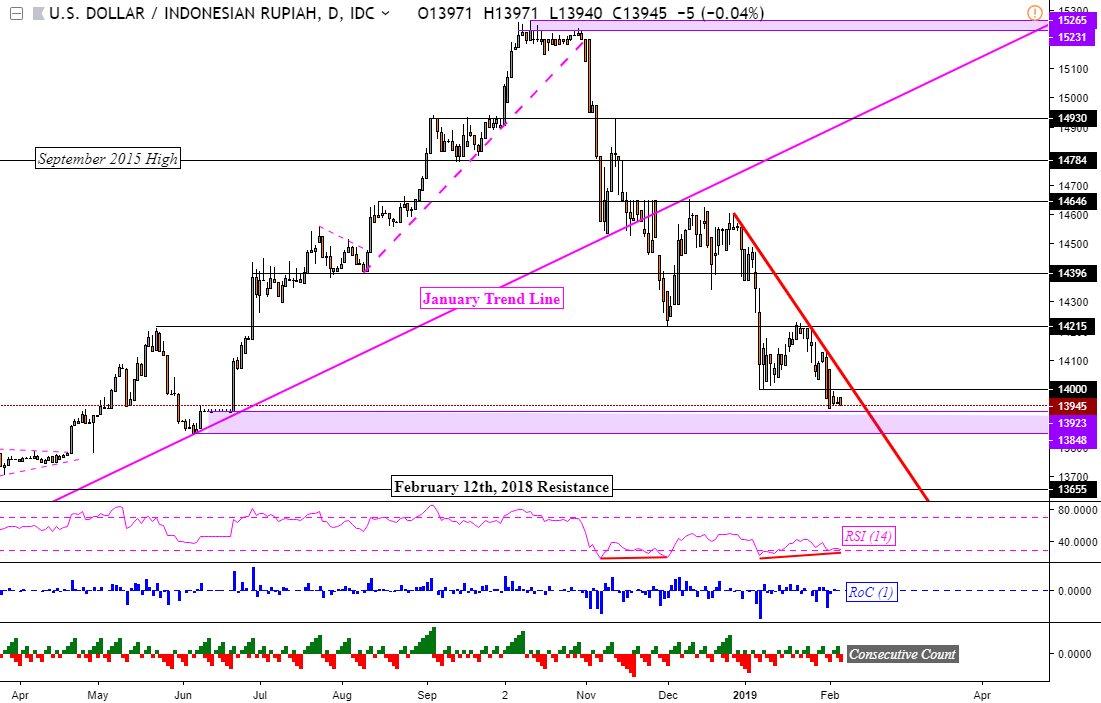
USD/IDR Technical Analysis – Support May Hold
The Indonesian Rupiah finds itself in a similar situation as the Malaysian Ringgit, USD/IDR is attempting to resume the dominant downtrend from November 2018. As it approaches immediate support (13,923 – 13,848), positive RSI divergence is overshadowing declines. If downside momentum here too fades, an uptrend would have to overcome a descending resistance line from the beginning of January. Pushing above it then places resistance at 14,215.
USD/IDR Daily Chart
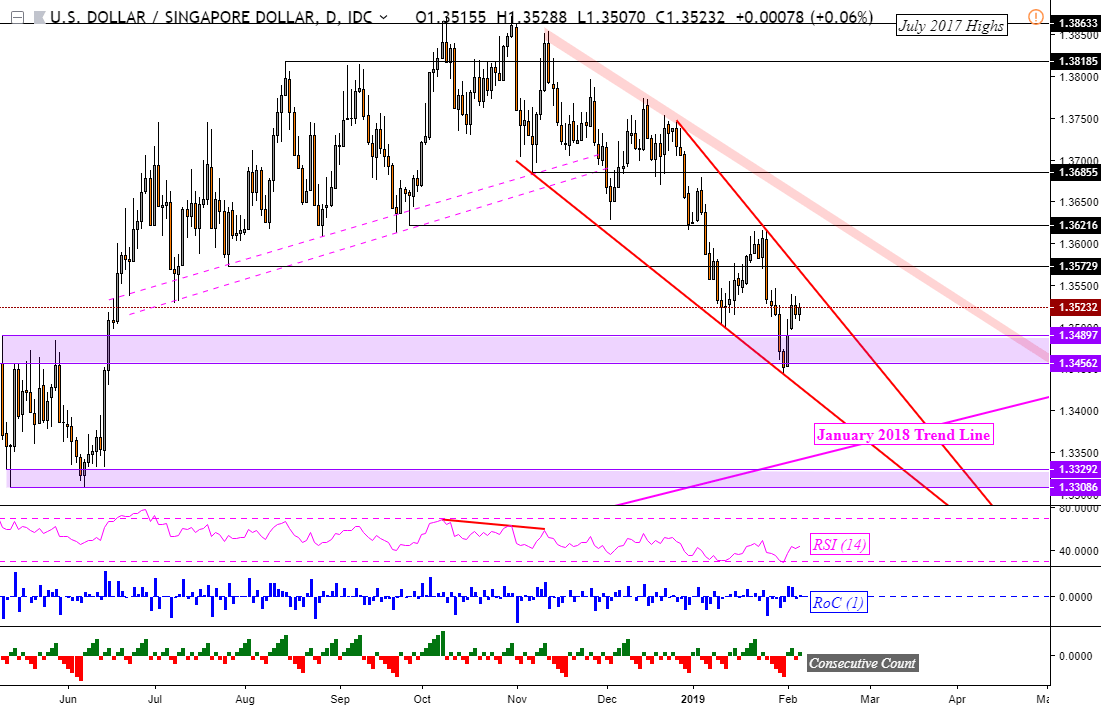
USD/SGD Technical Analysis – Facing Descending Resistance Next?
The US Dollar is attempting to make upside progress against the Singapore Dollar after support in USD/SGD held (1.34897 – 1.34562). However, the greenback faces multiple obstacles ahead. The first is a falling resistance line from December 2018. Pushing above it then exposes another one from November. Should USD/SGD resume its downtrend, a fall through support exposes a descending trend line from November.
USD/SGD Daily Chart
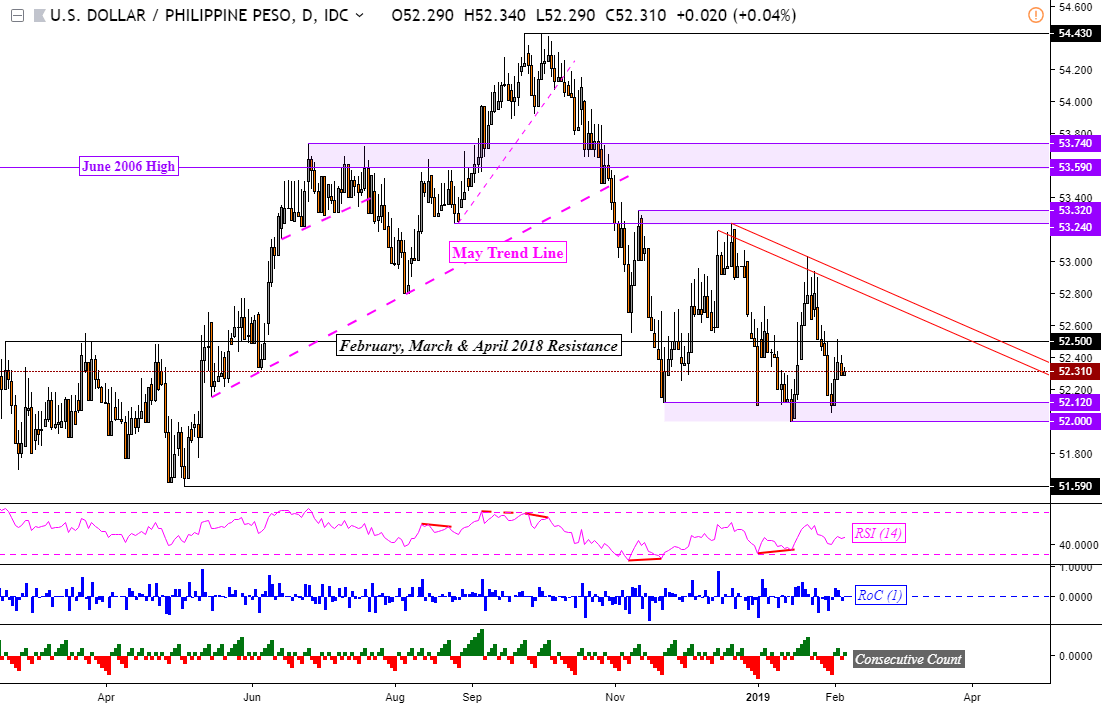
USD/PHP Technical Analysis – Two Months and Back to Square One
After about two months of consolidation, USD/PHP finds itself at roughly the same place. Key support has been reinforced between 52.12 – 52.00 while resistance appears to be a descending range from December 2018 (parallel red lines on the chart below). Pushing above it then exposes the next area of key resistance between 53.24 – 53.32.
For updates on the ASEAN pairs I am closely watching, you may follow me on Twitter @ddubrovskyFX for more immediate updates.
USD/PHP Daily Chart
**All Charts Created in TradingView
Read this week’s ASEAN fundamental outlook to learn about the underlying drivers for these currencies!
FX Trading Resources
- Just getting started? See our beginners’ guide for FX traders
- Having trouble with your strategy? Here’s the #1 mistake that traders make
- See how the US Dollar is viewed by the trading community at the DailyFX Sentiment Page
--- Written by Daniel Dubrovsky, Junior Currency Analyst for DailyFX.com
To contact Daniel, use the comments section below or @ddubrovskyFX on Twitter


