


With the final quarter of the year set to begin next week, we take a look at where prices of the euro, SPX, gold, and oil may be headed and key technical signposts to watch.
Technical Highlights:
- EUR/USD has potential for a head-and-shoulders
- Gold set to have a more volatile month, range-break towards new lows
- Crude oil, watch the 2008 trend-line on further strength
- S&P 500 bull continues until Feb 2016 t-line/200-day combo broken
See what fundamental drivers and technical developments will guide markets in the final chapter of the year in the just released DailyFX Q4 Trading Forecasts.
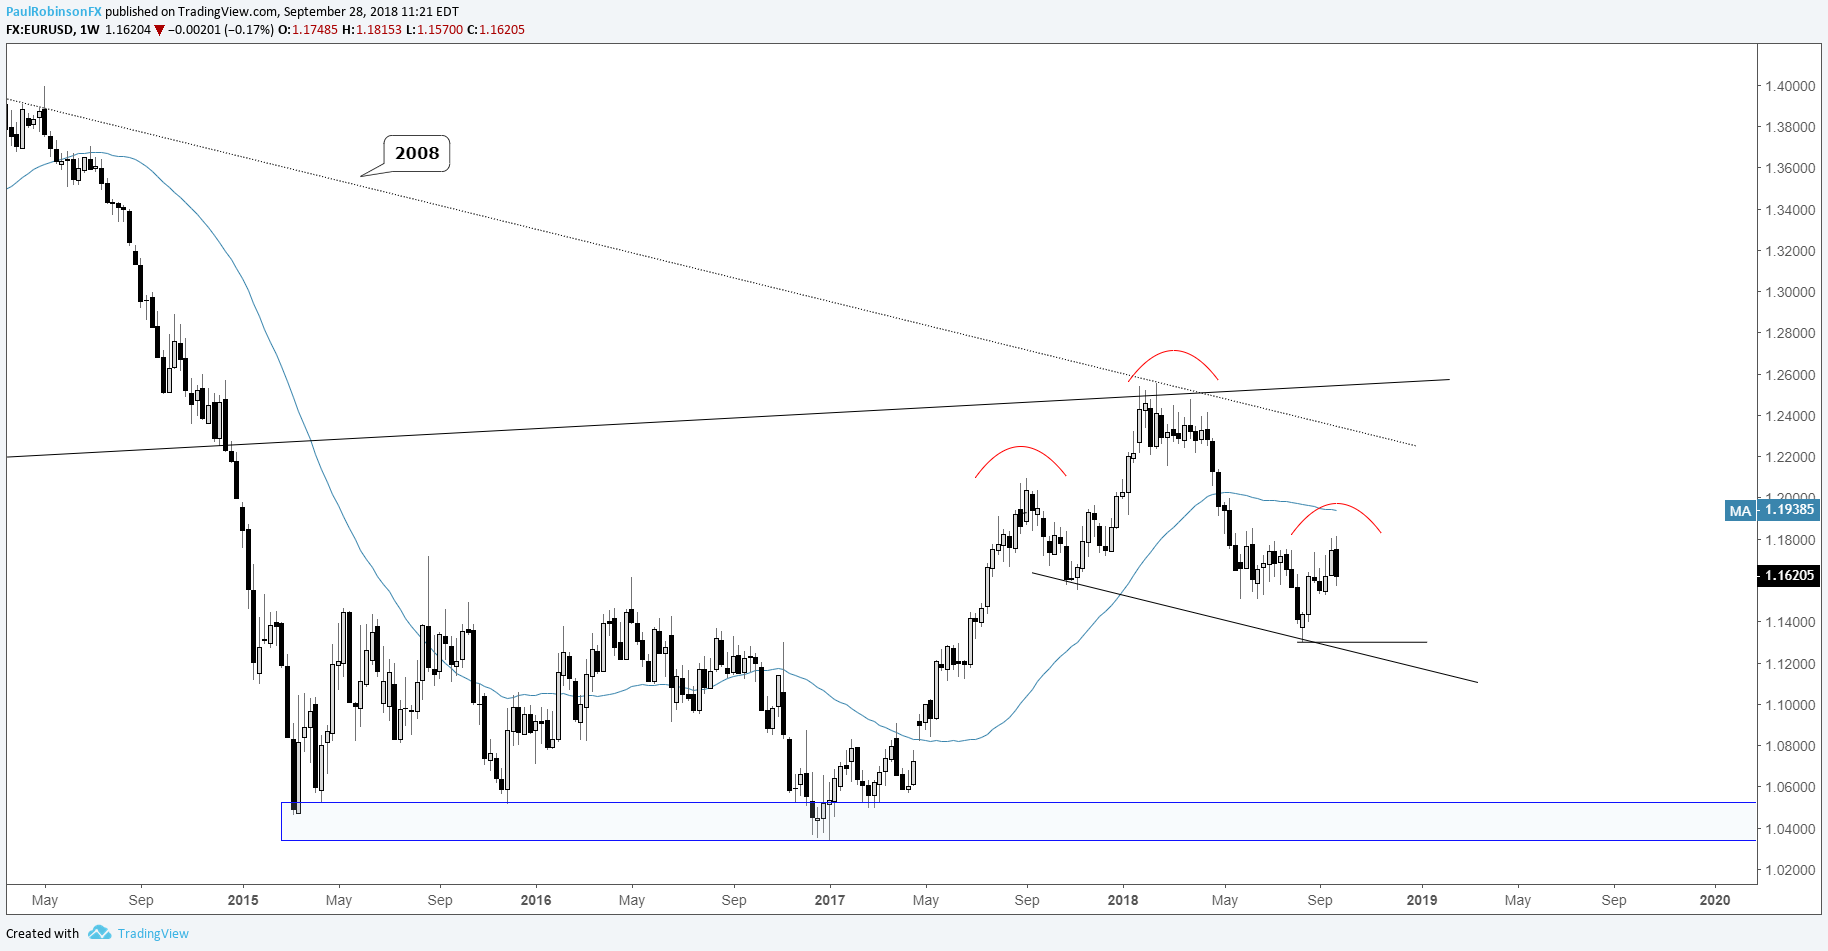
EUR/USD has potential for a head-and-shoulders
EUR/USDhas been chopping around in recent months, but that may soon end as we head towards the end of the year. One potential scenario on the radar right now is a head-and-shoulders, with the right shoulder nearing completion if it is to come to fruition. Support levels below need to break (August low/neckline), though, before validation and momentum starts to really pick up. But if a breakdown occurs we could be looking at lows carved out from 2015-2017.
EUR/USD Weekly Chart (H&S)
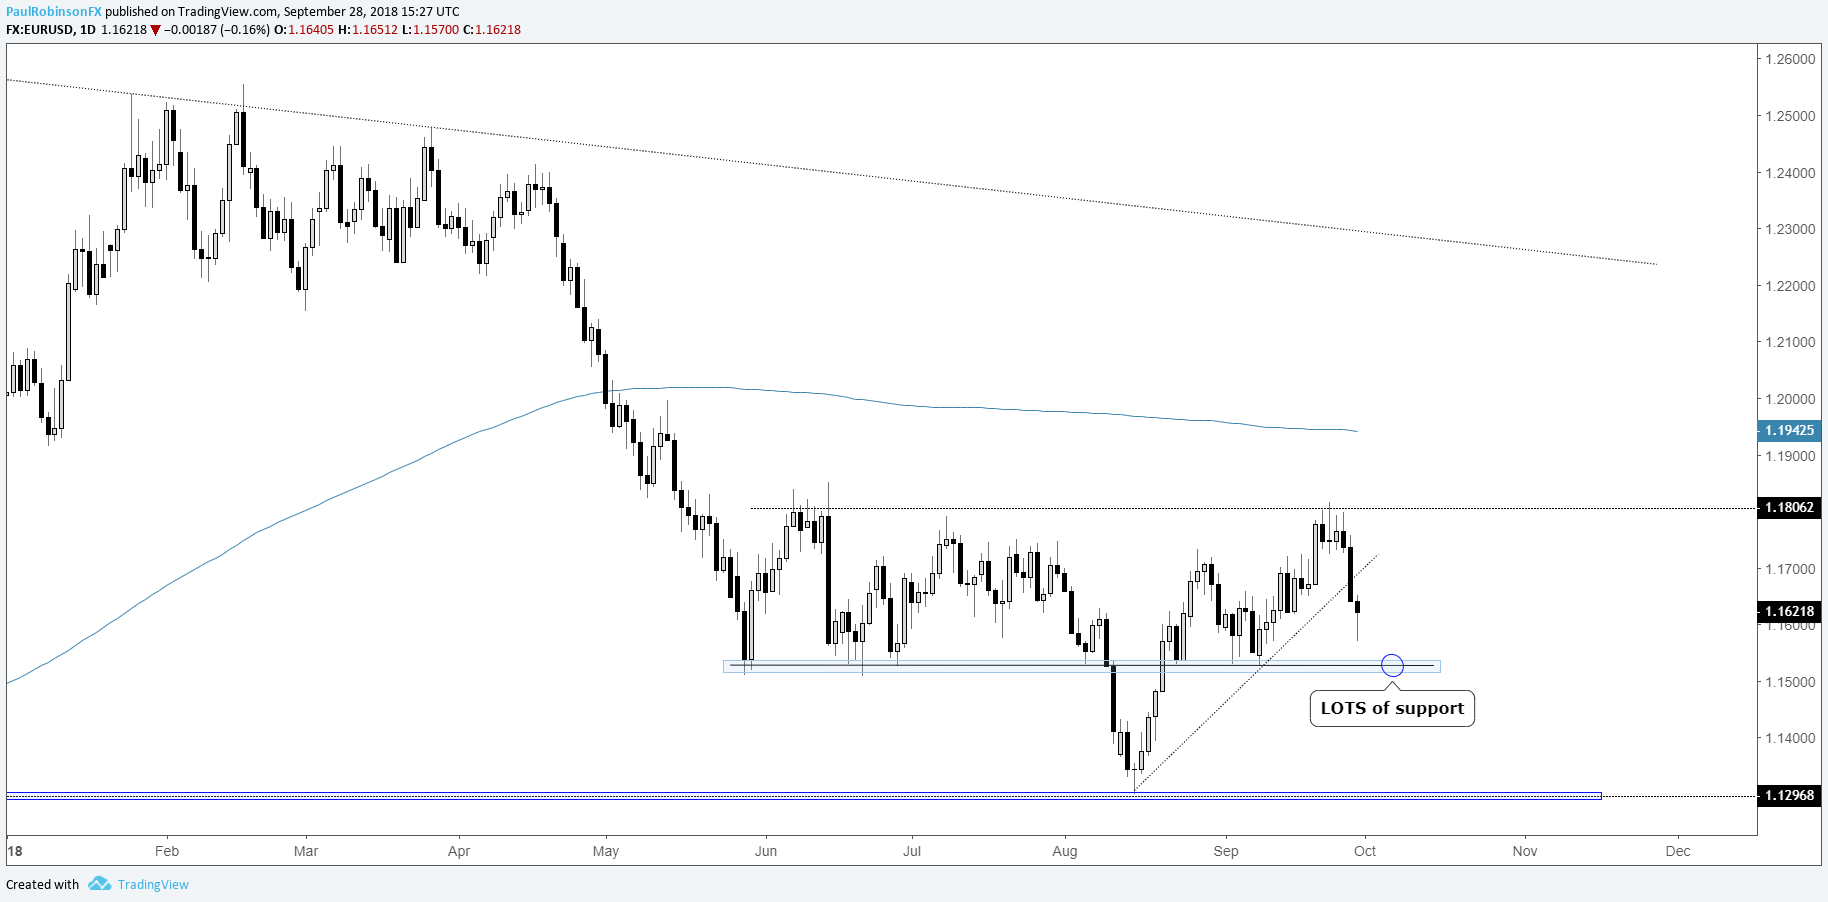
Looking at the daily time-frame, the 11500 level has been in play a lot the past few months. A break below 11500 significantly increases the odds of hitting the important 11310 low from the summer, or worse.
EUR/USD Daily Chart (11500 big support)
For more in-depth fundamental and technical analysis, check out the Q4 Forecast for EUR/USD
Gold set to have a more volatile month, range-break towards new lows
The range during September ranks as one of the smallest in a long time, setting gold up for a more volatile month in October. The trend is down and with the US dollar looking to go back on the offensive, that means another swoon may soon be in store.
The August spike-low at 1160 is first up as support, and after that there isn’t any highly visible support the December 2016 low near 1120. If things really start rolling downhill we may be looking at the 1046 low from December 2015.
Gold Weekly Chart (Levels to watch)

For more in-depth fundamental and technical analysis, check out the Q4 Forecast for Gold
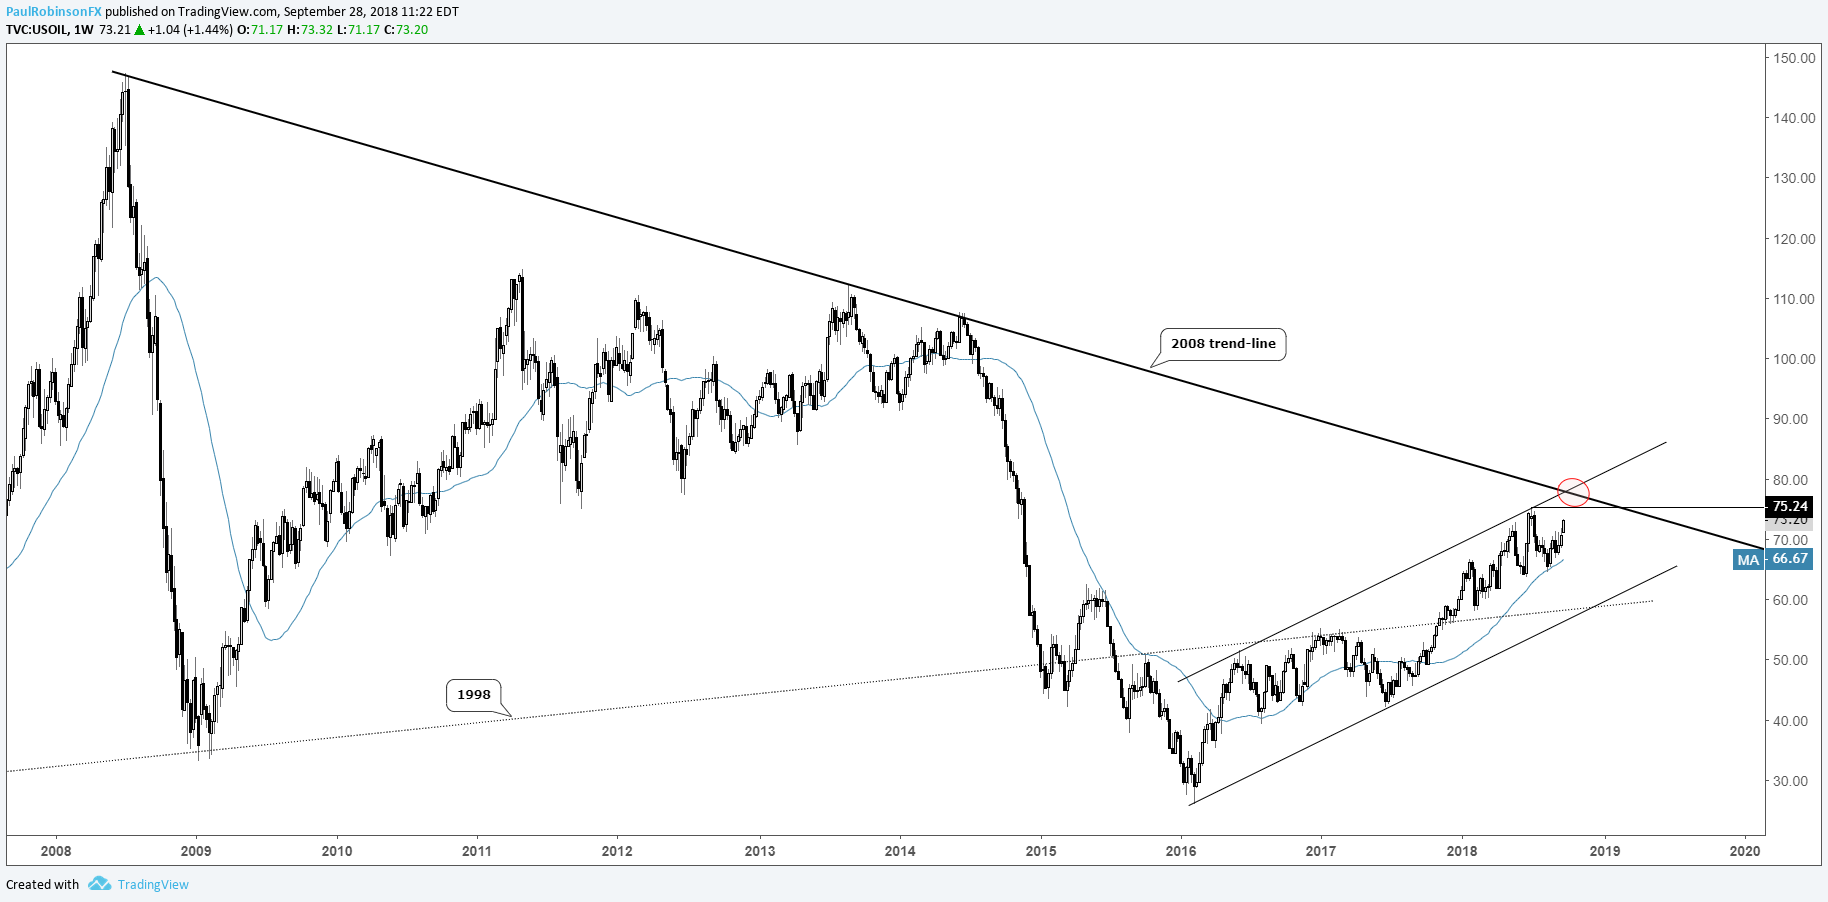
Crude oil, watch the 2008 trend-line on further strength
Crude oil may be posting a head-and-shoulders top; however, the right shoulder needs to identify itself soon or else this scenario is off the table. Without a turn lower, focus will move towards a breakout above the July high and the trend-line extending lower from the 2008 spike-high. A test of the trend-line would almost certainly raise volatility and in all likelihood send oil in reverse on a first attempt to break, if not cap the cycle off the 2015 low altogether. Calls for $100 Brent oil echo an overly bullish market.
Crude Oil Weekly Chart (2008 trend-line in sight)
For more in-depth fundamental and technical analysis, check out the Q4 Forecast for Crude Oil
S&P 500 bull continues until Feb 2016 t-line/200-day combo broken
After the downdraft to start the year the market looked headed for trouble, but has since put itself back together for yet another record run. The new high may indeed turn out to be a head fake and the sell-off to start the year a shot across the bow, but until the powerful combination of the Feb 2016 trend-line (end of prior bull market correction) and 200-day are broken, the market will remain pointed upward.
S&P 500 Weekly Chart (Feb '16/200-day combo important)

For more in-depth fundamental and technical analysis, check out the Q4 Forecast for Global Equity Indices
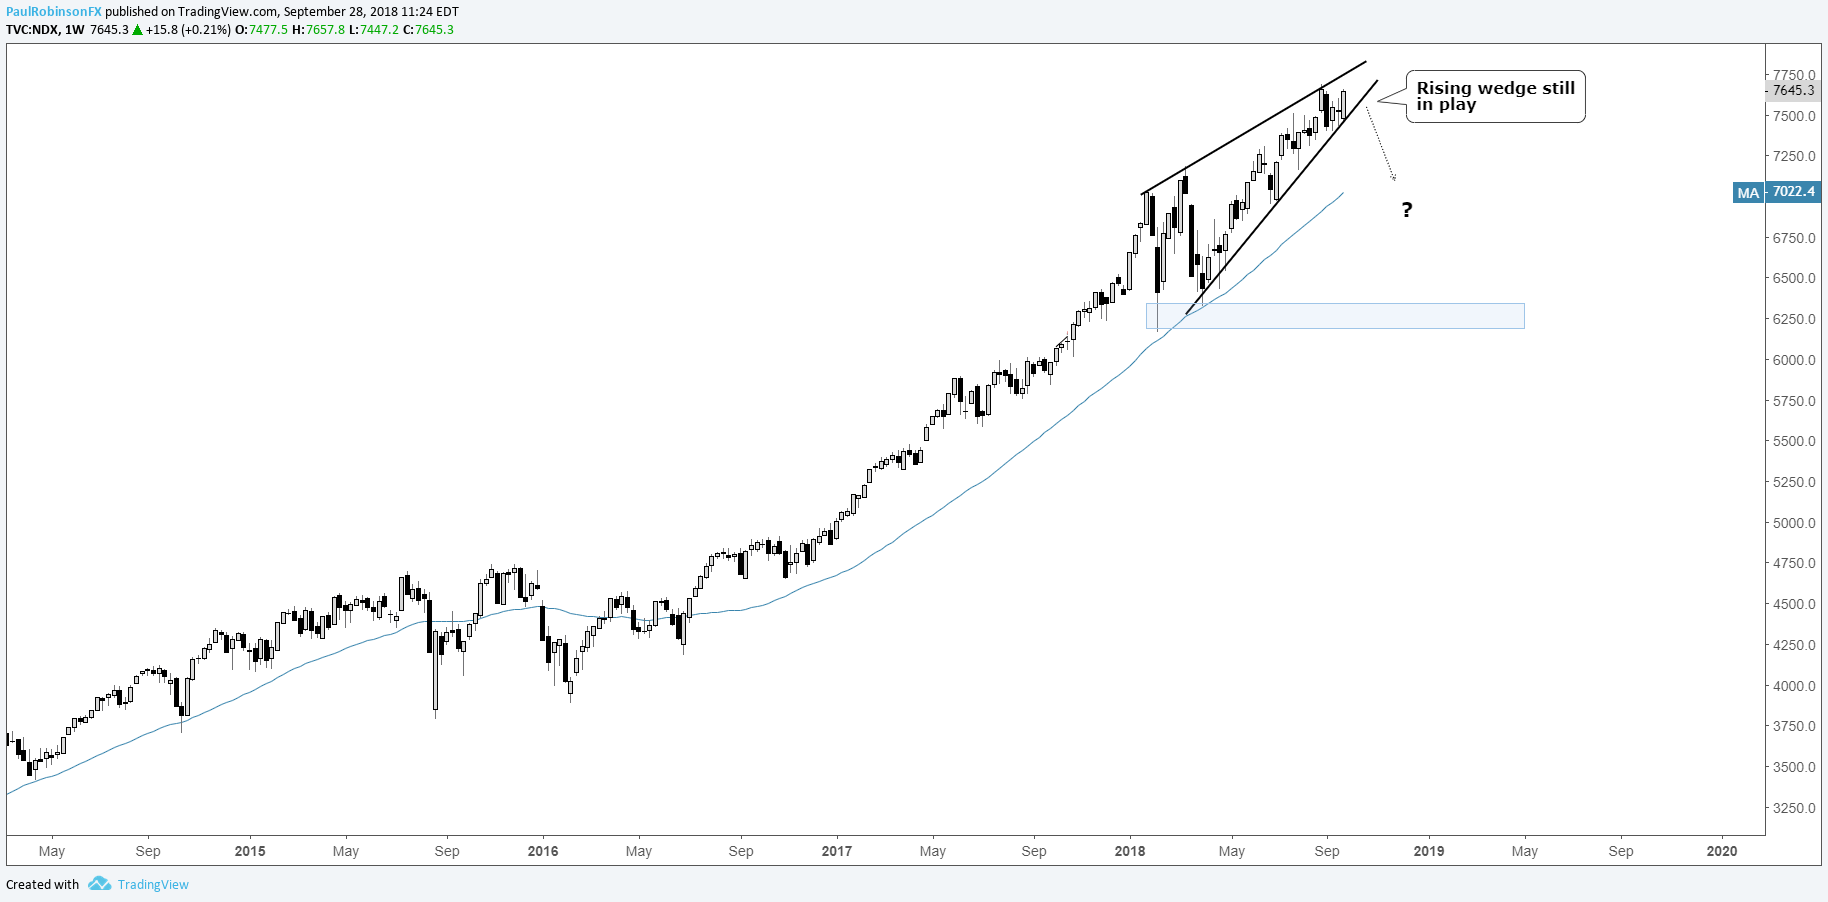
Keep an eye on the Nasdaq 100 and the bull-market darling group of stocks – FAANG (Facebook, Apple, Amazon, Netflix, and Google). This small group coupled with Microsoft account for about half of the weighting in the NDX. So goes the market leaders goes the market.
There is a still topping potential for the Nasdaq 100 with the continued development of a rising wedge on the weekly chart. A clear break of the lower trend-line is needed to validate the pattern. The market could shoot on higher and rally into year-end, so the bottom line is (as the case is with any price pattern) it won’t matter until it does, if it does. That is why waiting for validation on chart formations is so crucial.
Nasdaq 100 Weekly Chart (Rising wedge could spoil the party)
Helpful Resources for Forex and CFD Traders
Whether you are a new or experienced trader, we have several resources available to help you; indicator for tracking trader sentiment, quarterly trading forecasts, analytical and educational webinars held daily, trading guides to help you improve trading performance, and one specifically for those who are new to forex.
---Written by Paul Robinson, Market Analyst
You can follow Paul on Twitter at @PaulRobinsonFX


