


The cryptocurrency space continues to shrink in-line with long-term expectations that the group will remain in ‘mania unwind’ mode for the foreseeable future, but that doesn’t mean there aren’t still trading opportunities with volatility expected to remain elevated. Generally, the tilt is lower with intermittent rallies here and there. Today, we’ll look at Bitcoin price action around big support and Ethereum, which has, broadly speaking, held up better than other cryptocurrencies.
See how positioning changes on the IG Client Sentiment page can help identify price direction in cryptocurrencies and other major markets.
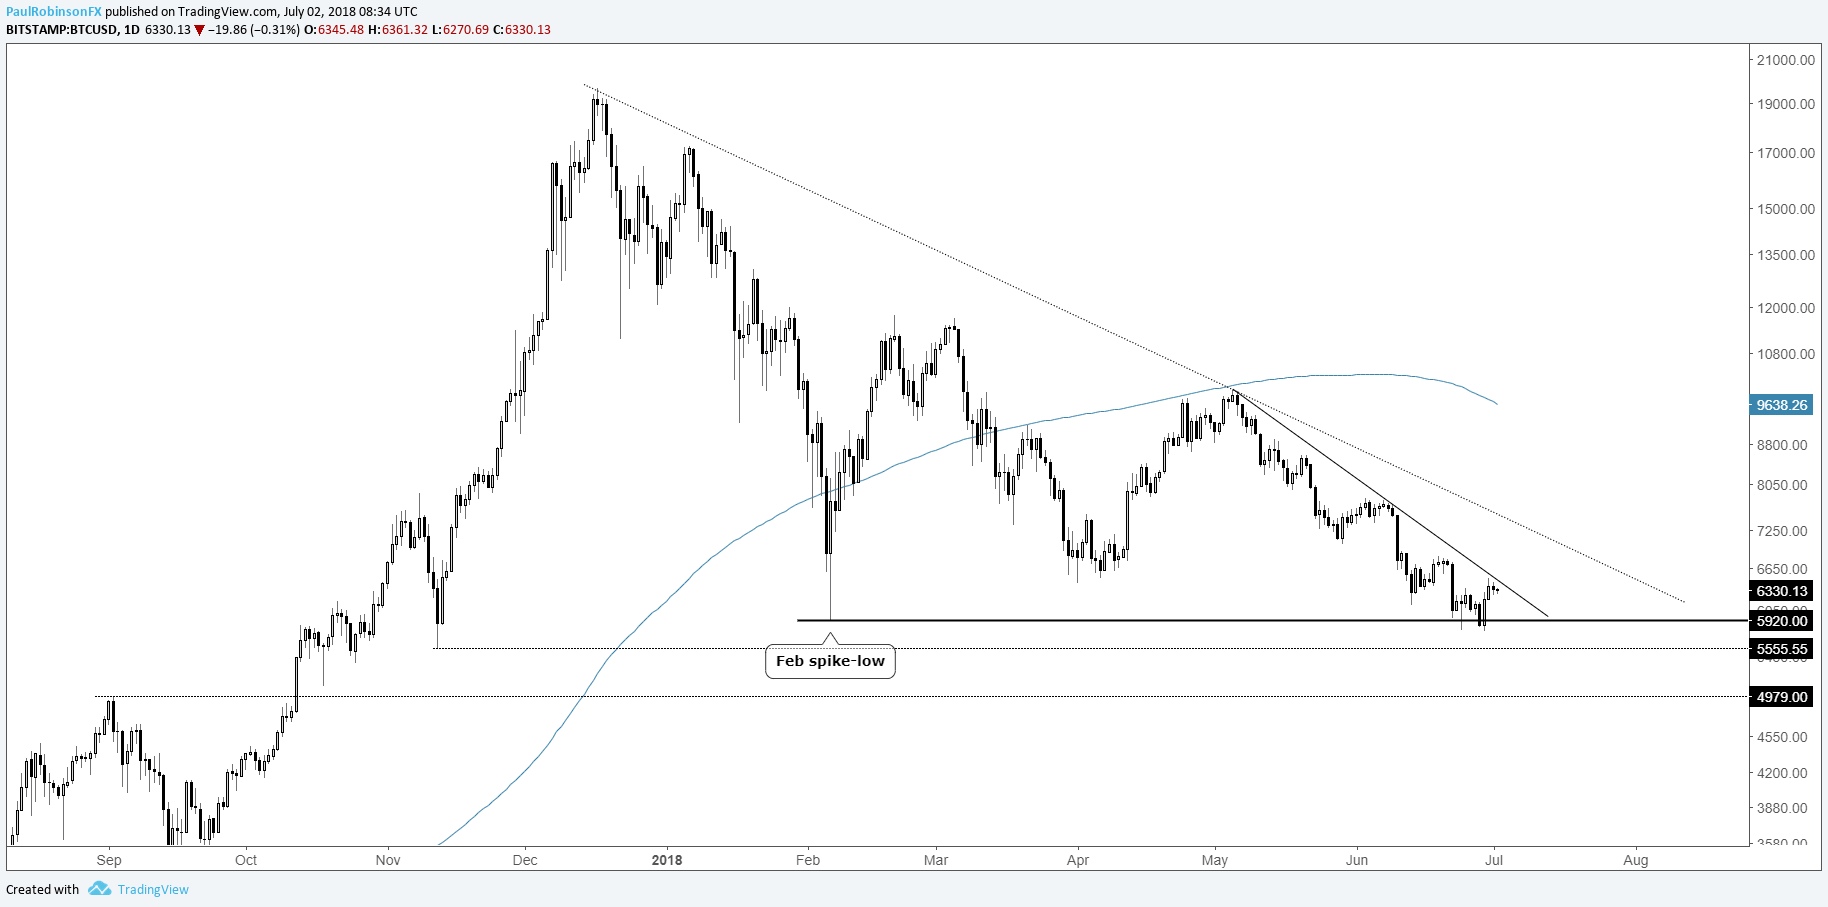
Bitcoin head fake below 5920, trend-line resistance in focus
Bitcoin recently dipped below the 5920 level (February spike-low) on a daily basis, but managed to stay above on a weekly closing basis. This is keeping a floor in BTC/USD for now, but if the trend since May is to turn positive, a move above the trend-line since then needs to be broken. If it is we may see a similar reprieve as the one which unfolded in April/May. However, as long as the trend-line puts a cap on the upside, sellers maintain control; but for downward momentum to reassert itself a clear break below the Feb spike-low will be needed.
Check out this guide to learn more about how to trade Bitcoin and other cryptocurrencies.
BTC/USD Daily Chart
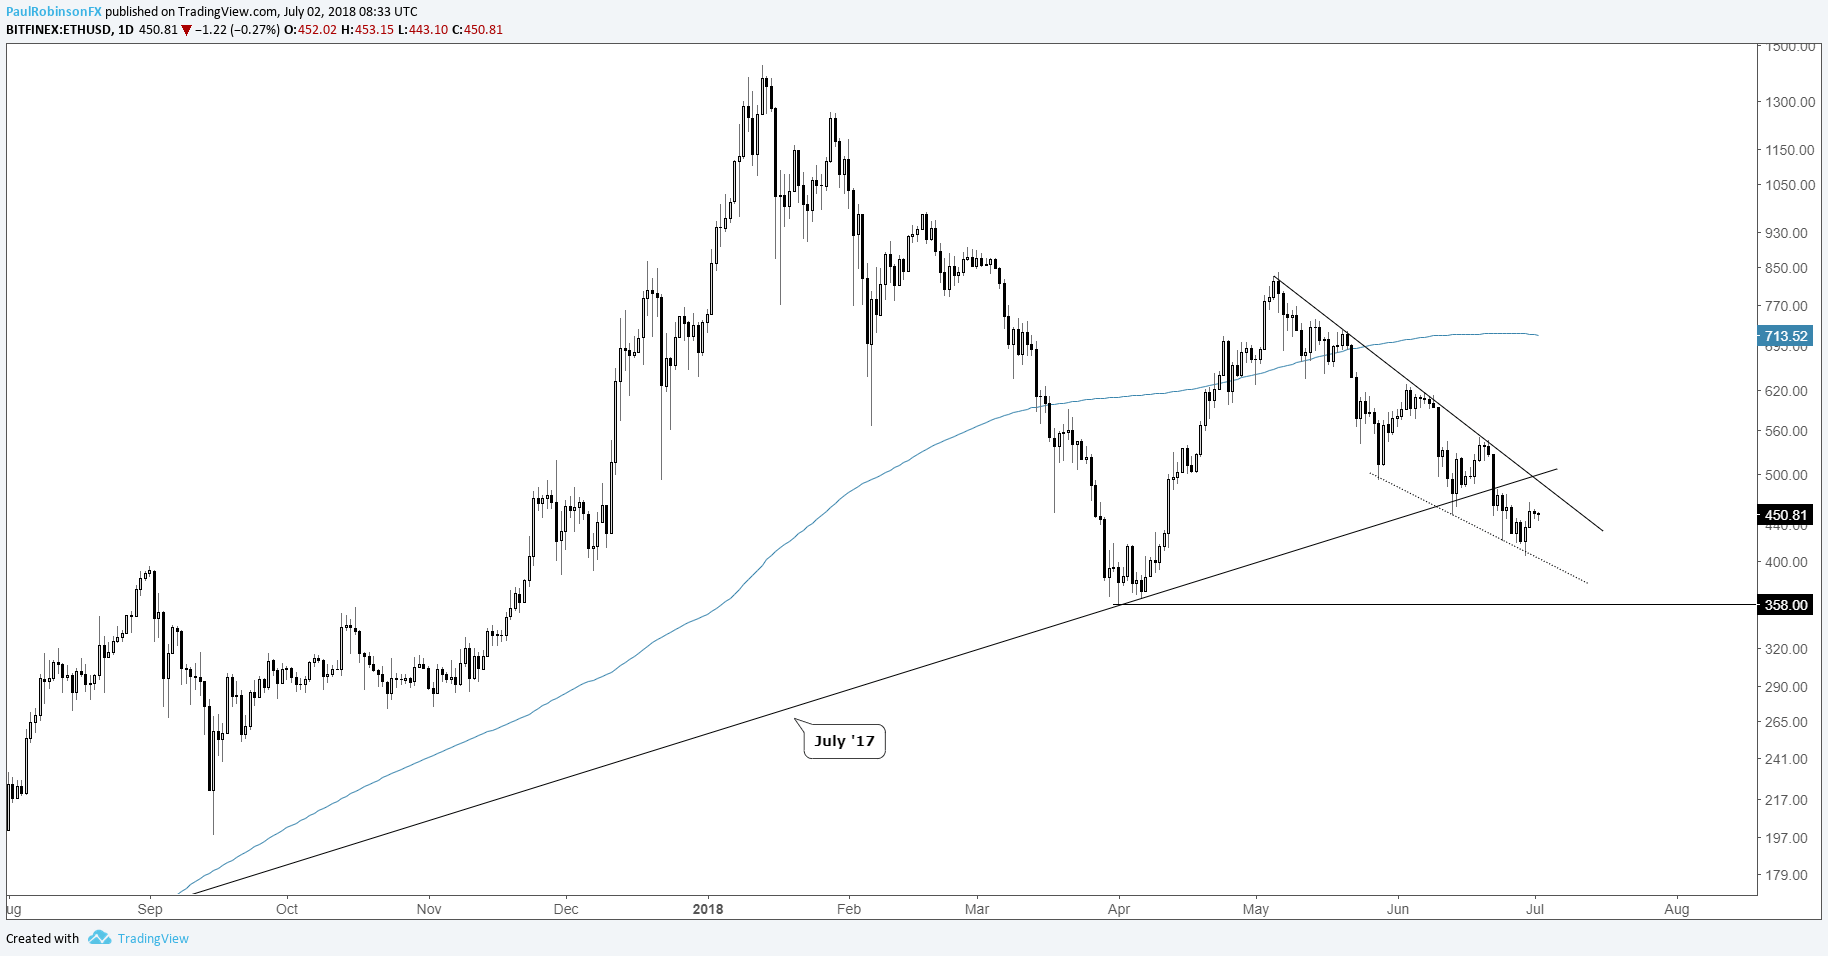
Ethereum trending lower, but remains above April low
Ethereum remains above the April lows, a feat many of the others in the group have been unable to do (in some cases price is much lower, looking at you Litecoin). However, it is stuck in a steady downward trend since May just as the others are. This keeps attention focused lower for now, perhaps we’ll see sellers come in and soon take ETH/USD down the April low at 358 soon. A break above the May trend-line, as is the case with BTC/USD too, could have another rally in focus similar to the one seen during the spring months.
ETH/USD Daily Chart
Helpful Resources for Cryptocurrency Traders
Whether you’re a new or experienced cryptocurrency trader, we have several resources to help you;Introduction to bitcoin trading guide, indicator for tracking trader sentiment, and a weekly webinar discussing the latest developments.
---Written by Paul Robinson, Market Analyst
You can follow Paul on Twitter at @PaulRobinsonFX


