


What’s inside:
- Ripple explosion could use a deep pullback, but a high-level consolidation could be all the ‘weakness’ it experiences
- Bitcoin near-term outlook becoming murky, watching trend-line & price support
- Ethereum continues advance, eying trend-line on a pullback
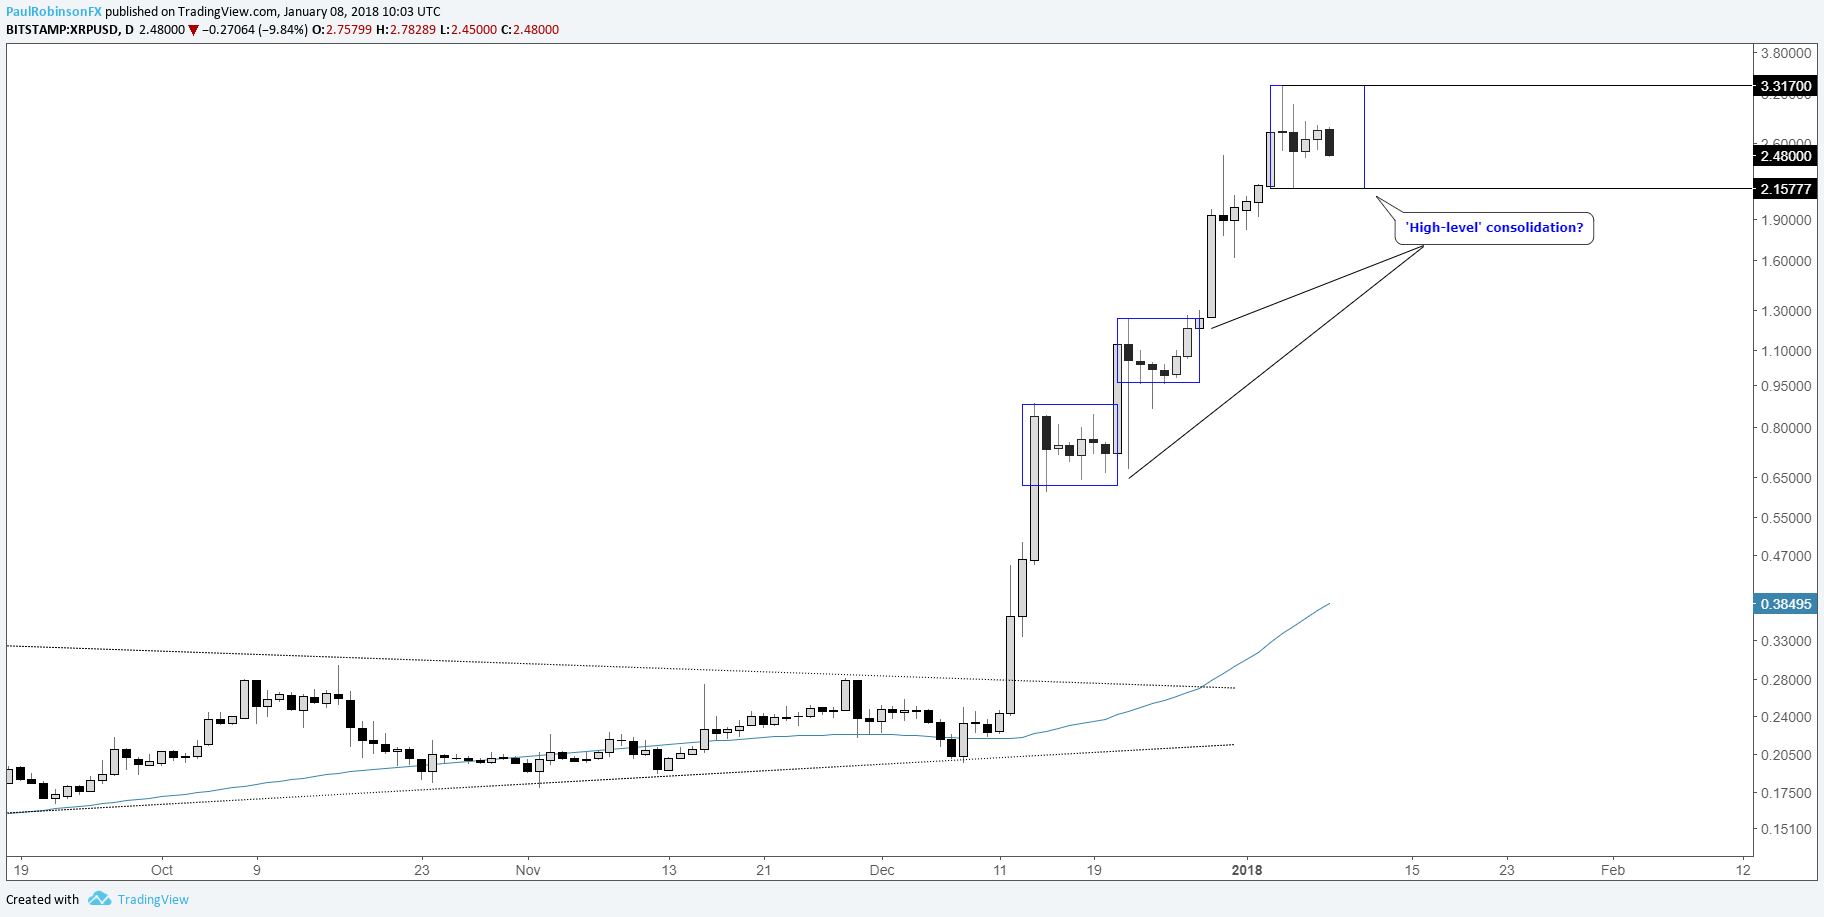
Ripple explosion could use a deep pullback, but a high-level consolidation could be all the ‘weakness’ it experiences for now
The rise in Ripple has stalled, at least momentarily. The question is, whether it is a high-level consolidation (basing pattern after extended rally) which will lead to another shot higher, or could a much deeper retracement be in the works? Since mid-December, we’ve seen two short-term consolidation periods result in a break to new highs. If the current pause is to do similarly, it should work towards a breakout any day now. A breakout above 3.317 would likely confirm the high-level consolidation scenario, while a breakdown below 2.1577 would suggest a deeper decline is underway. In either event, XRP/USD is very extended and in need of a rest. A breakout to new highs might find fresh buying, but given the meteoric rise in recent weeks traders may want to tread cautiously until a broader pullback takes shape, whether that is currently underway or will begin after a new high.
To learn more about Cryptocurrencies, check out the Introduction to Bitcoin Trading Guide
XRP/USD: Daily
Bitcoin near-term outlook becoming murky, watching trend-line
Bitcoin is pulling back at the moment, with trend-line support starting on 12/30 nearing. A hold of this near-term trend-line keeps the short-term technical structure positive. A breakout above 17234 needs to take shape to continue the rise toward the record at 19666. If the trend-line fails, a move back towards last month low or worse (slope starting in May) could develop (~12000/11500).
See how retail traders are positioned in Bitcoin and what it might mean – IG Client Sentiment page.
BTC/USD: Daily

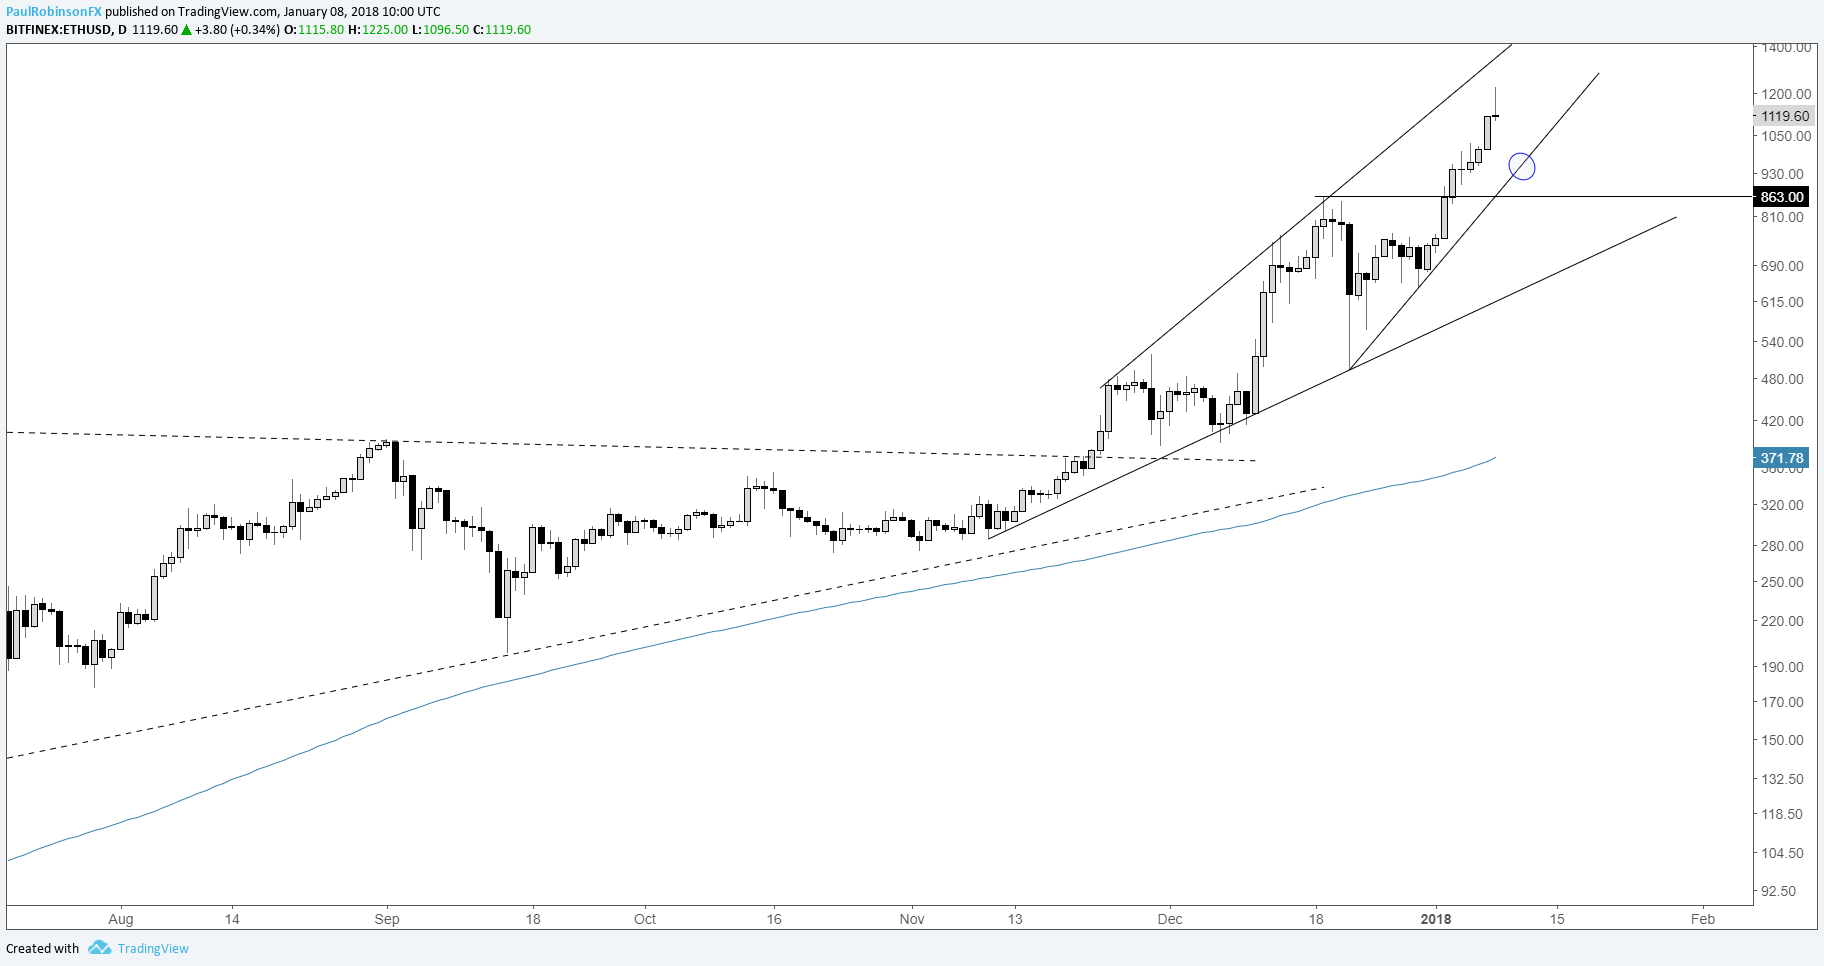
Ethereum continues advance, eying trend-line on a pullback
Ethereum rally continues, but could be showing signs of waning momentum. It’s too early in the day to call it a reversal, but if the daily bar results in a ‘shooting star’ (candlestick with a long tail and a small body), price action may be signaling a pullback. If this is the case, then watch the December trend-line and high for support on weakness.
ETH/USD: Daily
---Written by Paul Robinson, Market Analyst
To receive Paul’s analysis directly via email, please SIGN UP HERE
You can follow Paul on Twitter at @PaulRobinsonFX
http://bit.ly/2EZQiav


