


Gold Technical Forecast: Neutral
- Gold prices fell for the fifth week in a row, falling by 10% from the June high while running into support at the 1700 handle.
- Just below is another key spot of support around 1680, which has been tested three separate times since the top was set in August of 2020. With inflation continuing to surge and the Fed set to continue fighting by hiking rates, can Gold bulls stand in the way of a steeper decline?
- The analysis contained in article relies on price action and chart formations. To learn more about price action or chart patterns, check out our DailyFX Education section.

Gold prices continued to fall this week, bringing the running tally from last month’s high to a -10% loss (-9.96%, to be exact). I had looked into a bearish reversal setup just before that move began to show, and a month later bears remain in firm control of price action.
Coming into June Gold prices had built a rising wedge formation up to resistance around 1880. The rising wedge is often approached with the aim of bearish reversals, and starting in the middle of last month, that’s precisely what began to show. And, here we are a month later, and that theme remains in full bloom as sellers have pushed prices down to for a test of the 1700 psychological level, which has helped to hold support into the end of the week.
The bigger question, however, is how much gas bears have left in the tank after five consecutive weeks of decline and with prices coming very close to a major spot of support on the chart, plotted around the 1680 level that I’ll look into below the next chart.
Gold Daily Chart: Rising Wedge Breakdown
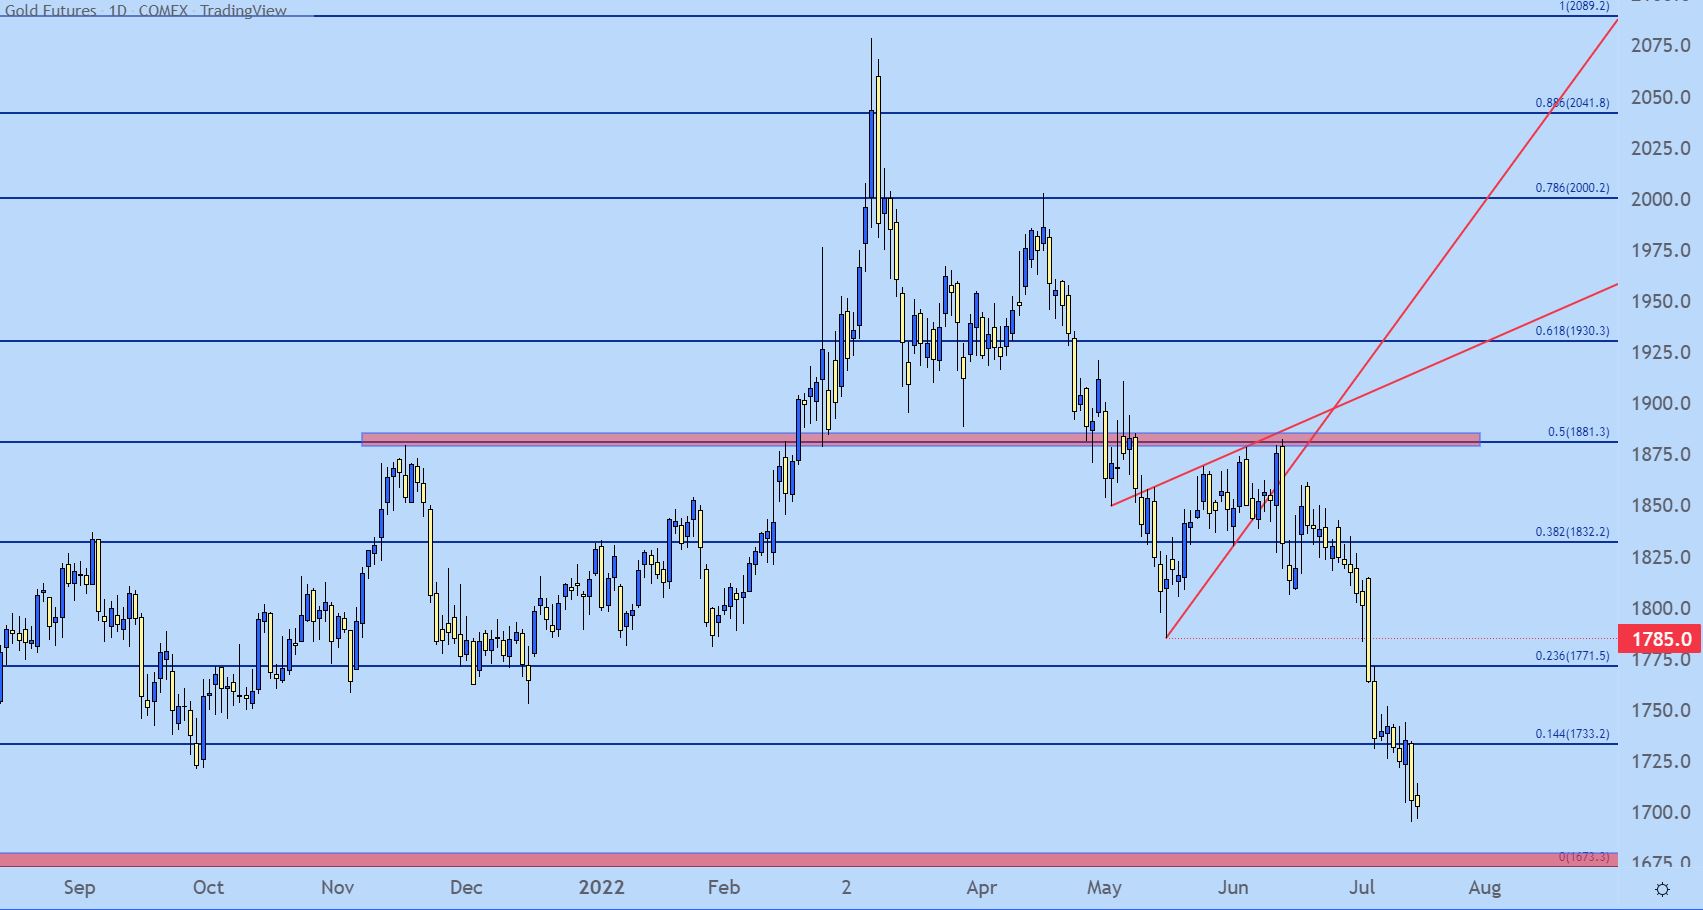
Chart prepared by James Stanley; Gold on Tradingview
Taking a step back to the weekly chart highlights some significant levels that remain at play.
Last week’s low came in a key zone, spanning from 1723-1733. That didn’t hold for long, however, as sellers pushed through that this week. The next spot of support is a major one and plots from 1673 up to 1680. This is the home of two year lows in Gold prices, and its so far seen three separate tests, most recently in August of last year.
A breach below that zone is a big deal as it opens the door for a further slide, with follow-through support all the way down around 1420.
The big question is whether that break can happen now, as sellers are already fairly stretched as that big support zone around 1680 comes into the picture. I do think it will be taken out at some point, possibly even in Q3, or perhaps even around one of these Fed meetings as markets are expecting the bank to go more and more hawkish. But, for next week, I’m setting the technical forecast to neutral as the odds of a break seem unfavorable for the week ahead.

Gold Weekly Price Chart
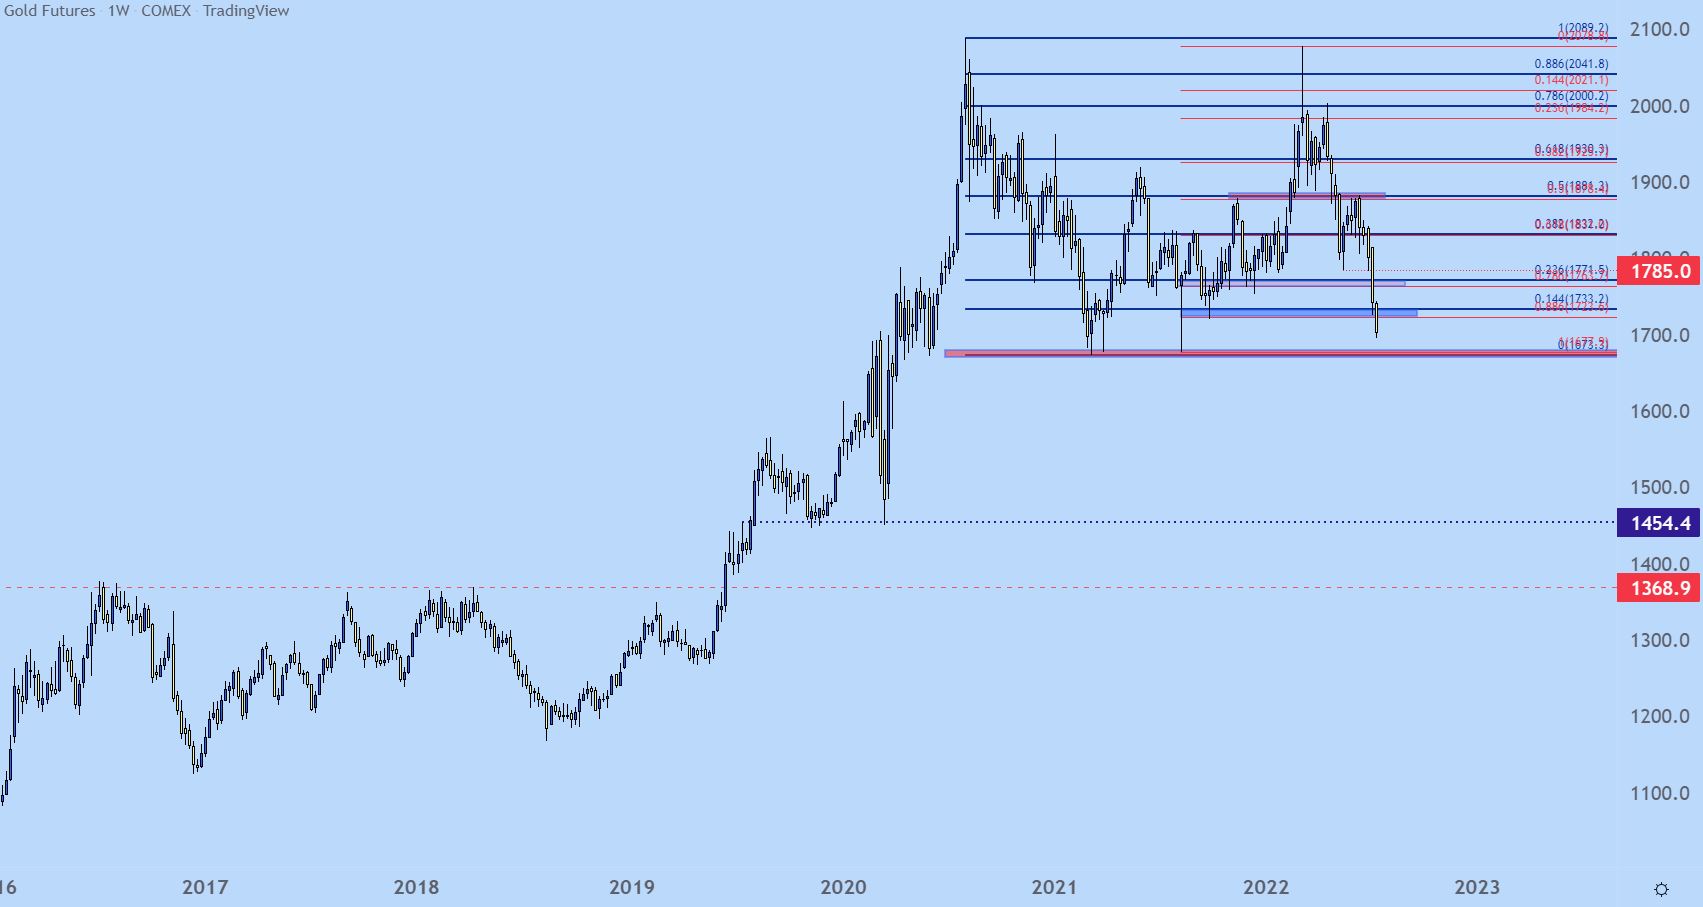
Chart prepared by James Stanley; Gold on Tradingview
Gold Strategy Moving Forward
Ideally, sells are triggered at or near resistance, not support. And support is somewhat of what we have to deal with at the moment with 1700 coming in to help hold the lows.
Now, that’s not to say that a strong rebound is going to develop. It might, but I don’t have enough evidence to suggest as such, so I’m keeping the forecast at neutral versus going bullish. But, the more enticing setup on the bearish side of Gold is a move up to resistance at one of these prior support zones. A show of resistance there re-opens the door for bearish trend strategies, and that move might have the motivation to test through two-year-lows.
One such zone exists between Fibonacci levels plotted at 1723-1733, and if bulls can force a strong retracement, there’s another that runs from 1763-1771. That second zone may seem a stretch, but, it’s really just a 38.2% retracement of the sell-off that started a month ago, so the bearish trend would remain in workable order even with a pullback to that zone.

Gold Four Hour Price Chart
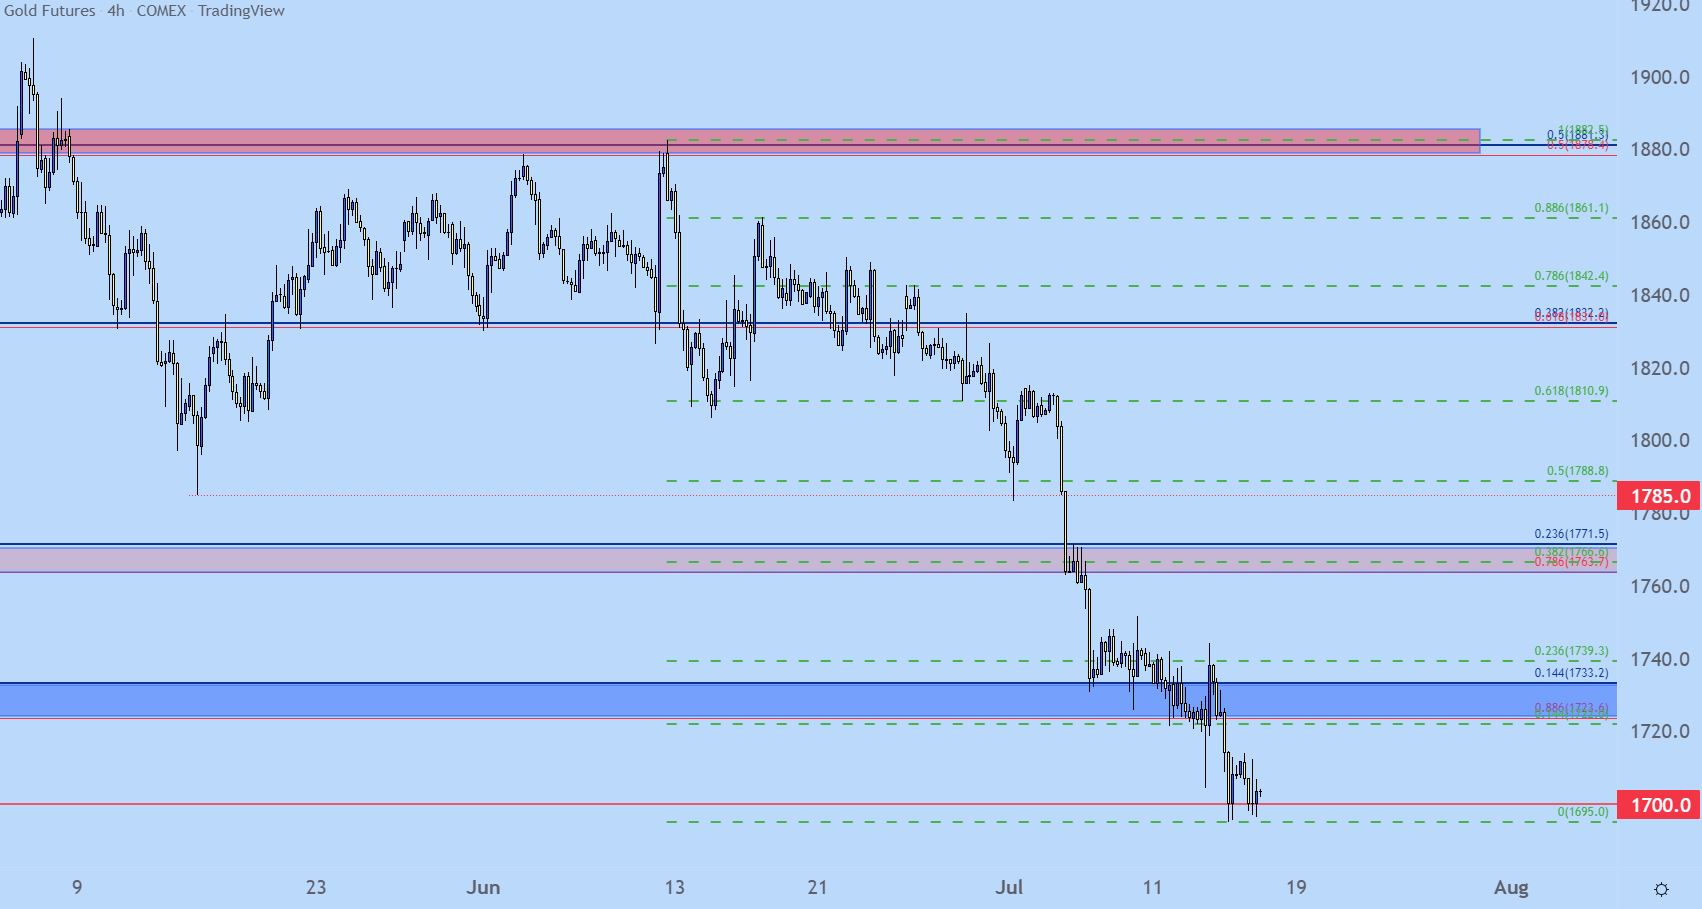
Chart prepared by James Stanley; Gold on Tradingview
--- Written by James Stanley, Senior Strategist for DailyFX.com
Contact and follow James on Twitter: @JStanleyFX


