


Indices Technical Forecast: Bearish
- The equity recovery continued through last week, furthering the pullback from lows set in June.
- This pullback appears to be corrective in terms of a bigger picture down-trend. Timing the return of bearish price action is the challenge and next week brings CPI data for the month of June which has been a bearish driver for equities of late. The following week marks the start of earnings season and then the Fed’s rate decision is in the final week of July. So there’s potential for volatility on the economic calendar.
- The analysis contained in article relies on price action and chart formations. To learn more about price action or chart patterns, check out our DailyFX Education section.

The first full week of Q3 saw more recovery in US equities. Stocks continued to firm from June lows and there was building hope that initial signs of slowing data might compel the Fed to alter course, and this even started to build some expectations for rate cuts down the road, perhaps even as early as late-2023. That would in essence be driven by an expectation for the Fed to be responding to recessionary pressures by instituting rate cuts, which would mean we’d need to go into a recession to get there. That hasn’t happened yet, so positing that stocks have already bottomed – before the recession that the Fed would be responding to, seems to be a bit of a stretch at this point. More explainable is the fact that no trends move in straight lines and that move in June had gotten into an oversold state.
The Nasdaq had given back almost 34% from the high that was set in November of last year. Losing more than a third of an index’s value in a little over six months is a remarkable move by any stretch, and it may not be done yet. I’m retaining my bearish outlook for equities, largely on the basis of the Fed’s need to continue hiking rates in the effort of addressing inflation. There’s been no signs of that abating yet, despite speculation across markets this week that, maybe, perhaps, there could be rate cuts coming later in 2023 in response to recessionary drive.
To get there, however, we’d first need to see the economy go into a recession which hasn’t happened yet, so postulating that stocks may have already bottomed before a recession has been confirmed, which may compel the Fed to alter course (which could then support equity rallies) seems a bit of a stretch at this point.
Instead, we’re seeing a pullback in the sell-off and this isn’t really all too different from what showed up in March. In March, just after the Fed’s first hike of this cycle, equities spent the next two weeks ripping-higher. The Nasdaq added 17.97% over that period of time – and all that happened was the Fed had started tightening policy.
Sellers showed back up around the Q2 open and drove for the majority of the period before finally digging into some support in mid-June, again around a FOMC rate decision acting as the pivot. This rebound has only gained about 10% in the Nasdaq, however, so there may be more room to run before bears make their re-entrance into the situation.
As far as drivers are concerned, the Fed remains a push point and their next rate decision is later this month and markets are geared up for another 75 bp hike, with a currently expected 50 bp hike for September. During that FOMC meeting later in July, there will also be earnings season and I think this is where the next spark can show as this will be the first series of earnings reports that we get after the FOMC tightening cycle has started. How companies have held up through the initial tightening and, perhaps more importantly, how they’re planning to adjust given the continued rates of inflation will be the next major item for equities.

S&P 500
The big item in the S&P 500 showed up on Tuesday to start the holiday-shortened week in the U.S., as price held the same support that was in play on Thursday and Friday of the week before (at 3741) which allowed for a move back above the 3830 Fibonacci level. That strength then continued through the rest of the week as prices pushed-higher towards the 3948 resistance level and that remains a level of note for next week’s trade. Beyond that, the 4000 psychological level looms large and this would be an area of interest for lower-high resistance in the broader bearish trend, if it does come into play next week.
For support, the 3802-3830 zone remains a key spot, and below that we have the three-day-low around 3741. If that breaches, a trip back to 3700 and lower looks likely, with the Fibonacci level at 3660, which has so far helped to arrest the lows, as a point of vulnerability.
S&P 500 Daily Price Chart
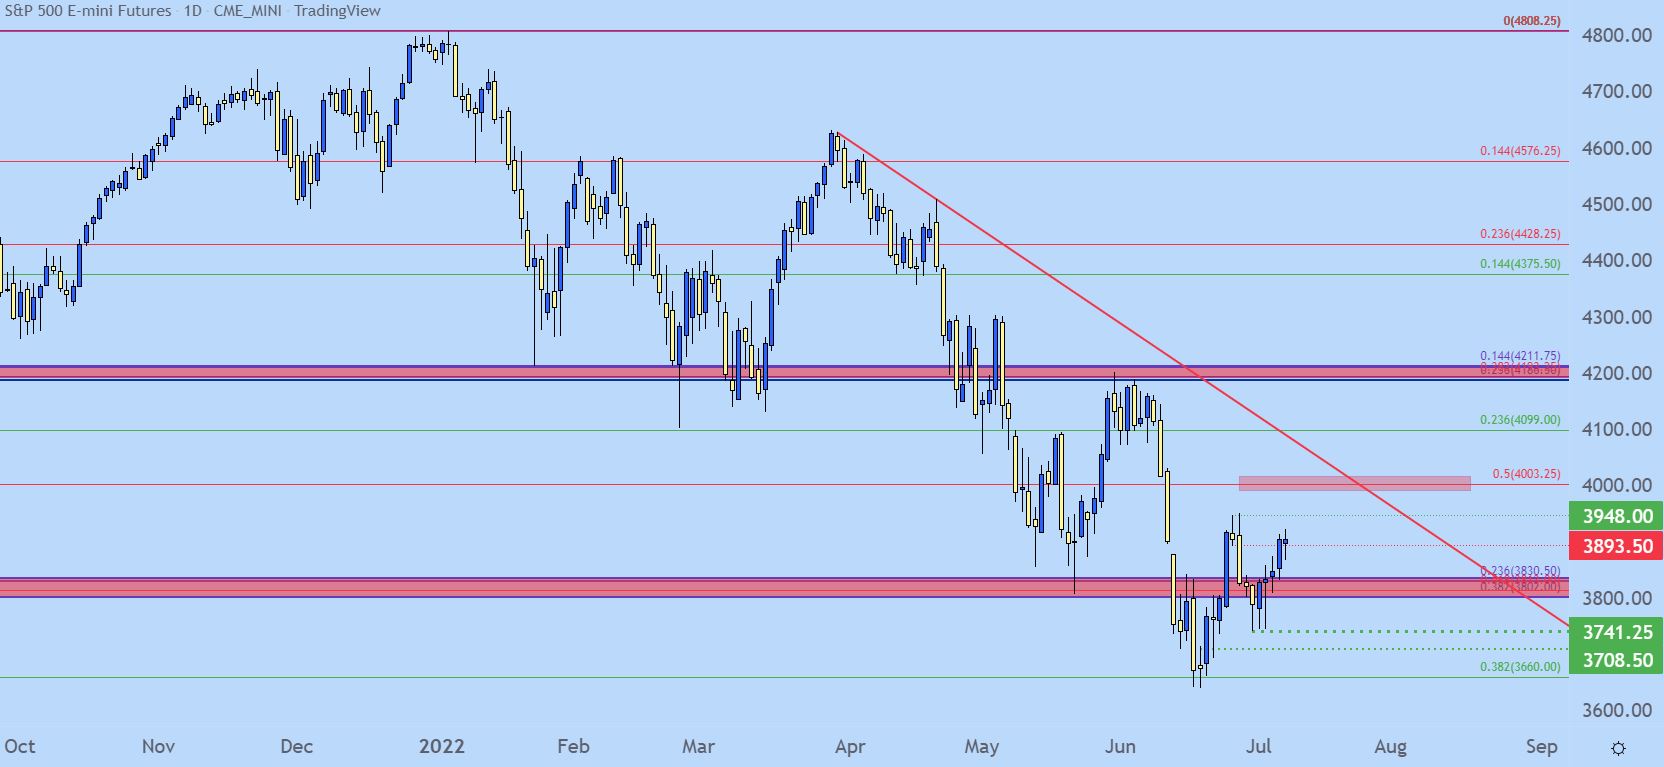
Chart prepared by James Stanley; S&P 500 on Tradingview
Nasdaq Breakout from Falling Wedge May Have More Room
The tech-heavy index has led the way down during this recent tightening cycle and I expect that to continue. But, at this point prices continue to hold around a key spot on longer-term charts, as 11,700 is the 50% retracement of the pandemic move, and while that’s already been traded through, sellers have had difficulty substantiating any lasting momentum below that level just yet.
This has allowed for a falling wedge formation to form, and those are often followed with the aim of bullish reversals. That formation filled-in on Thursday of last week and prices pushed higher on Friday. This keeps the door open for a continued move towards the 12,585 level, and if that’s broken-through, a major area of support/resistance comes into play in the zone running from 12,894-13,050.
Resistance showing at either of those levels can re-open the door for bearish trend strategies.

Nasdaq 100 Daily Price Chart
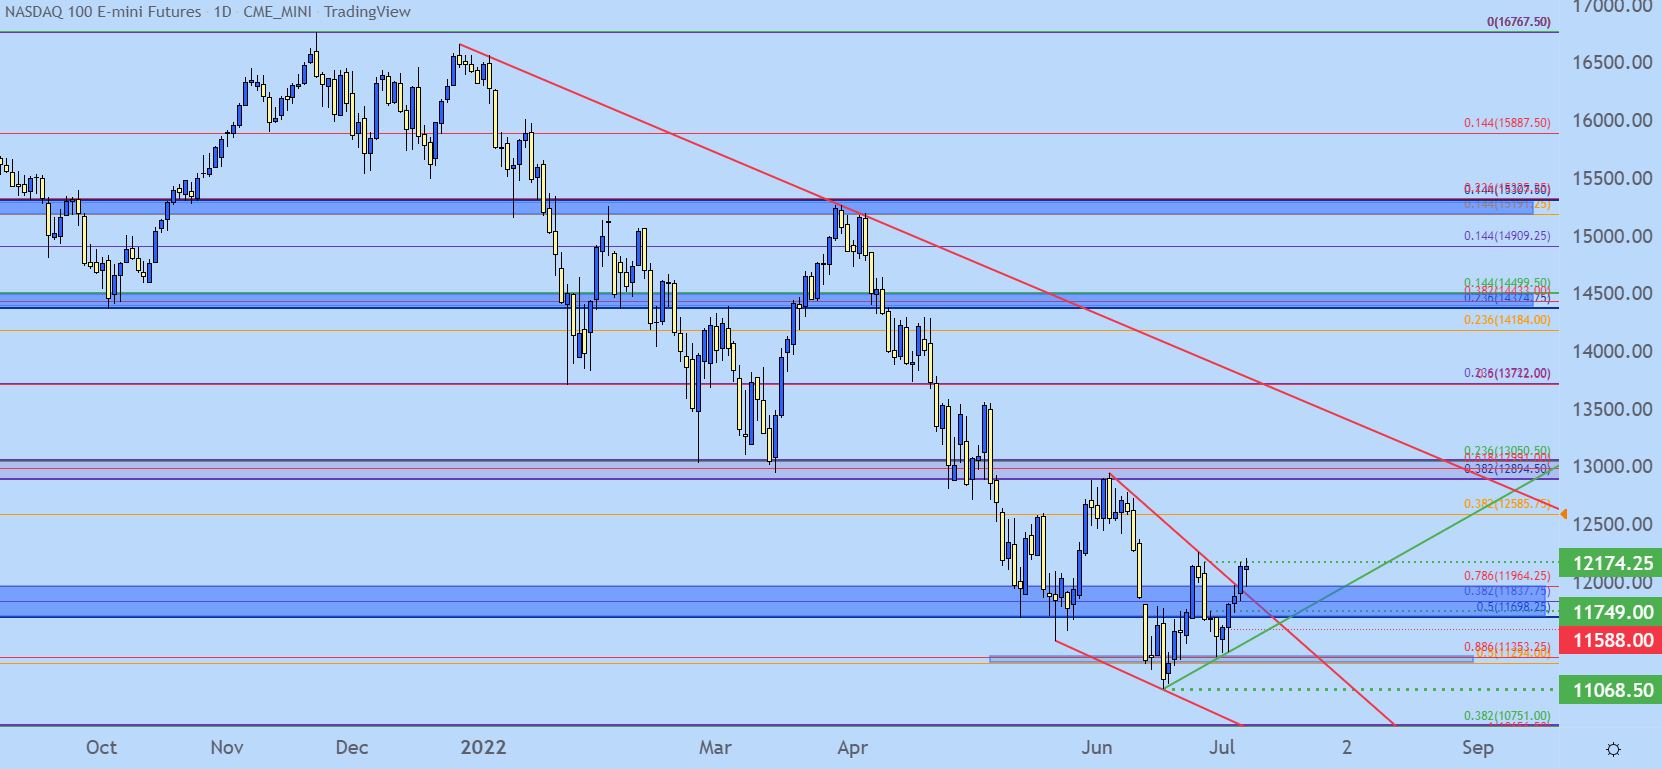
Chart prepared by James Stanley; Nasdaq 100 on Tradingview
Dow Jones: Resistance at Prior Support
The Dow ran into a major spot of support in June that’s so far been able to hold sellers at bay. The 30k psychological level is confluent with the 38.2% Fibonacci retracement of the pandemic move and there’s also a 61.8% Fibonacci retracement nearby at 30,109 as taken from a more recent major move.
When price action slammed into this zone last month after the FOMC rate decision, there was an intense grind before the tides began to turn. But, given recent dynamics there’s a couple of different spots of interest here, first at current resistance around 31,393. This is the 50% marker of the more recent Fibonacci retracement below but it’s also around a price that previously helped to set support just before that support test at 30k.
And a bit higher is another resistance zone of note, plotted around the 32,500 psychological level. This area similarly has confluence while also having played a prior role as both support and resistance. If price action can force a move up to that zone, bearish strategies could be attractive, looking for bigger-picture trend continuation.

Dow Jones Weekly Price Chart

Chart prepared by James Stanley; Dow Jones on Tradingview
--- Written by James Stanley, Senior Strategist for DailyFX.com
Contact and follow James on Twitter: @JStanleyFX


