


British Pound Technical Forecast: Neutral
- GBP/USD fell for a second week, setting a fresh multi-year low
- Prices may rebound, but the chances for a trend reversal look slim
- The 21-day EMA may offer stiff resistance if bulls press forward

GBP/USD Technical Forecast
The British Pound fell against the US Dollar for a second week, notching a loss that brought prices to the lowest levels since March 2020. A political storm around Prime Minister Boris Johnson drove much of that weakness. Mr. Johnson's resignation on Thursday removed some political uncertainty. That allowed prices to trim weakness into the weekend.
On the weekly timeframe, the Relative Strength Index (RSI) crossed below its 30 mark, reflecting an "oversold" position. A move into sub-30 RSI territory doesn't mean weakness cannot continue. In fact, an RSI crossover typically sees a follow-through move. The Average True Range (ATR)—a measure of volatility—rose to levels not seen since early 2021. That bodes poorly for Sterling in the near term, as traders may sell into strength until that volatility cools.
GBP/USD Weekly Chart
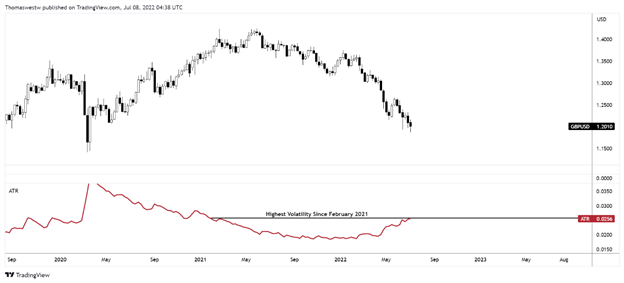
Chart created with TradingView
Zooming into the 8-hour chart shows GBP/USD trimming its losses into the weekend after setting a fresh July low at 1.1874. The MACD oscillator made a cross above its signal line during that bounce, a bullish sign. However, prices face a tough path to retake recent losses following a break down from a Bear Pennant pattern in late June.
The falling 21-day Exponential Moving Average (EMA) has proven itself to be the level to break through in late June. That EMA may provide stiff resistance should bulls press the attack in the week ahead. If broken, GBP/USD has a chance of rallying and reversing its broader downtrend. A move back to the June and July lows may be more likely, given recent price action as well as the bearish posture seen on the weekly timeframe. Overall, GBP/USD looks poised for further weakness.
GBP/USD 8-Hour Chart
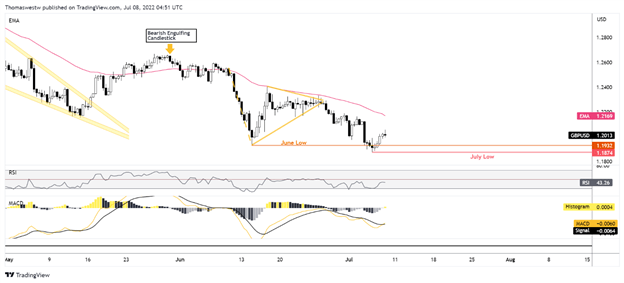
Chart created with TradingView
Trade Smarter - Sign up for the DailyFX Newsletter
Receive timely and compelling market commentary from the DailyFX team
--- Written by Thomas Westwater, Analyst for DailyFX.com
To contact Thomas, use the comments section below or @FxWestwater on Twitter


