


Indices Technical Forecast: Neutral to Bullish
- The market posted a reversal week, but fear levels seem to still be too low
- Could see more upside in the near-term, but watch to see if momentum wanes

S&P 500 Technical Forecast
The S&P 500 bounced hard to end last week. This put in a reversal candle for the week that is seen as suggesting more upside in the days ahead. However, at this time all that is expected is a bounce as the bear market looks set to continue until we see a capitulation low. In order for this to happen we will need to see the VIX spike and fear rise sharply. Thus far we aren’t seeing much in the way of fear.
In the near-term a recovery bounce is anticipated to at take price up to the Feb low at 4114, where a very meaningful test will take shape. At this time it is viewed as a possibly a very meaningful form of resistance that could cap the bounce before another major leg lower develops.
Even if resistance ultimately holds it may get a little rough around that line, in that price may jab above and back below, perhaps on several occasions before resistance is confirmed. But a repeated struggle around 4114 would be a good sign for would-be shorts that the bounce is ending in favor of renewed weakness.
S&P 500 Daily Chart

Nasdaq 100 Technical Forecast
TheNasdaq 100 is also bouncing from a lower parallel that has price in recovery mode as we head into a new week. On the top-side I will be watching for meaningful resistance to come in just over the 13k mark. Until then, there may be some bumps in the road if the recovery scenario is to work out, but dips are likely to be short-lived, if even they are fast and furious.
Nasdaq 100 Daily Chart
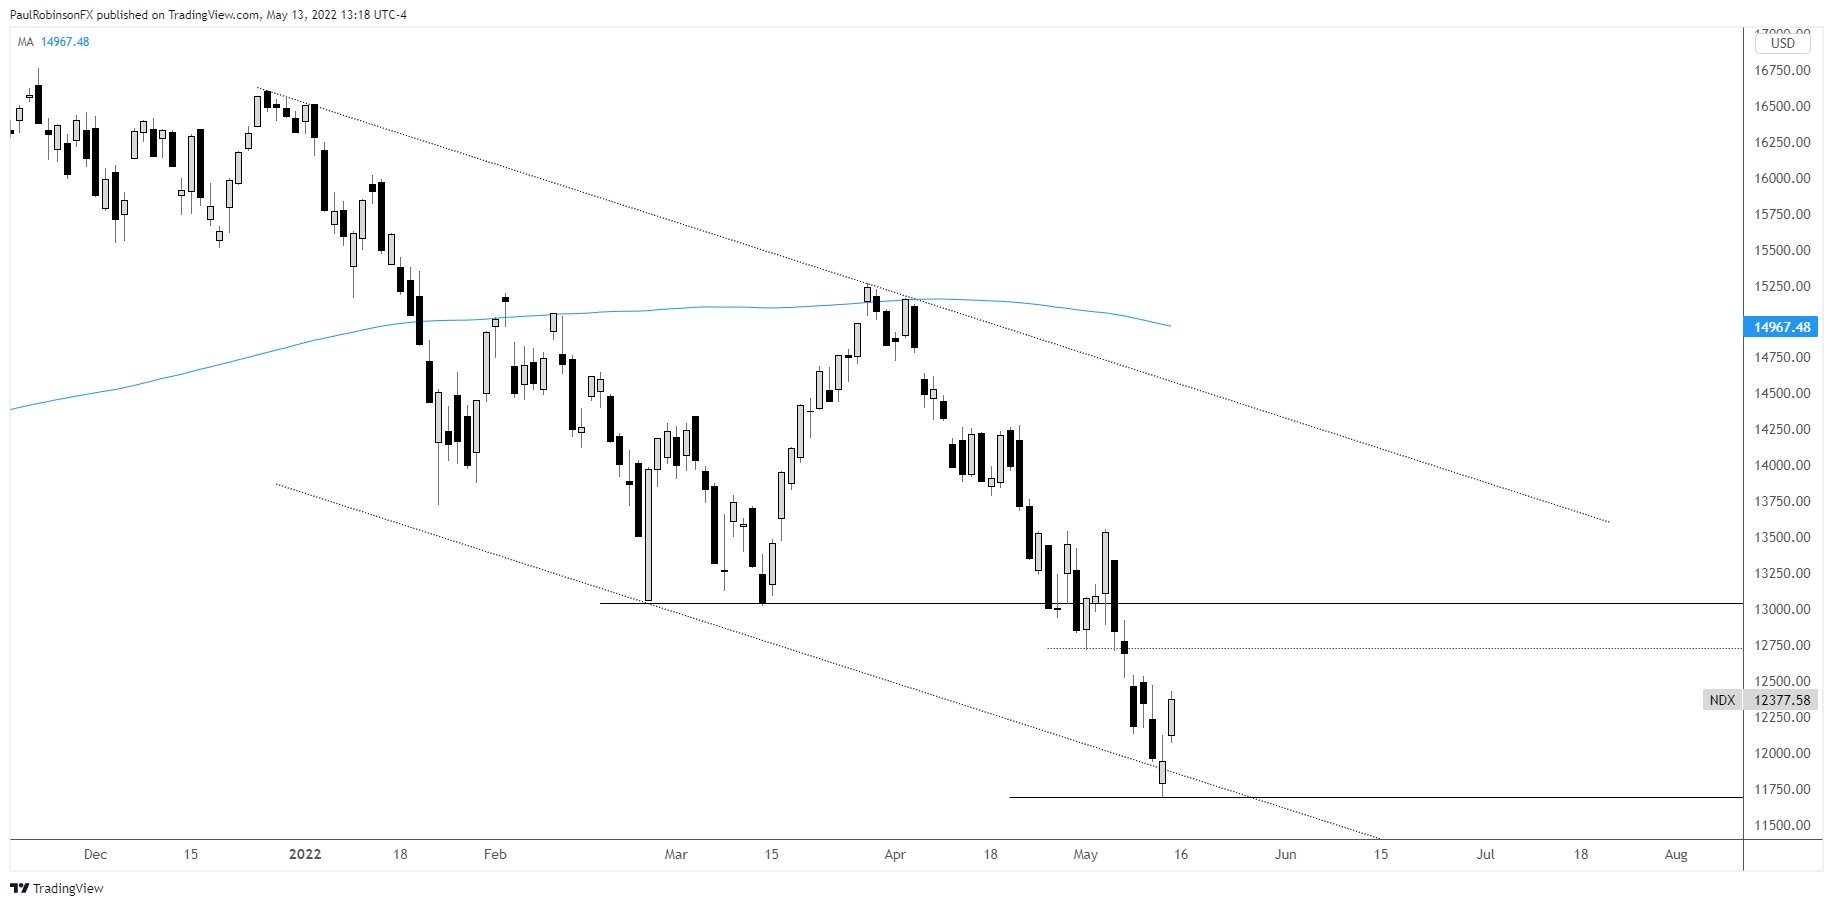
Nasdaq 100 Chart by TradingView
Dow Jones Technical Forecast
The Dow Jones is already finding itself in trouble on this bounce because it was generally stronger than the other indices so the Feb low is closer at hand. Don’t be surprised to see if get recouped if the other indices are going to continue a bit higher before testing their important winter lows.
Dow Jones Daily Chart
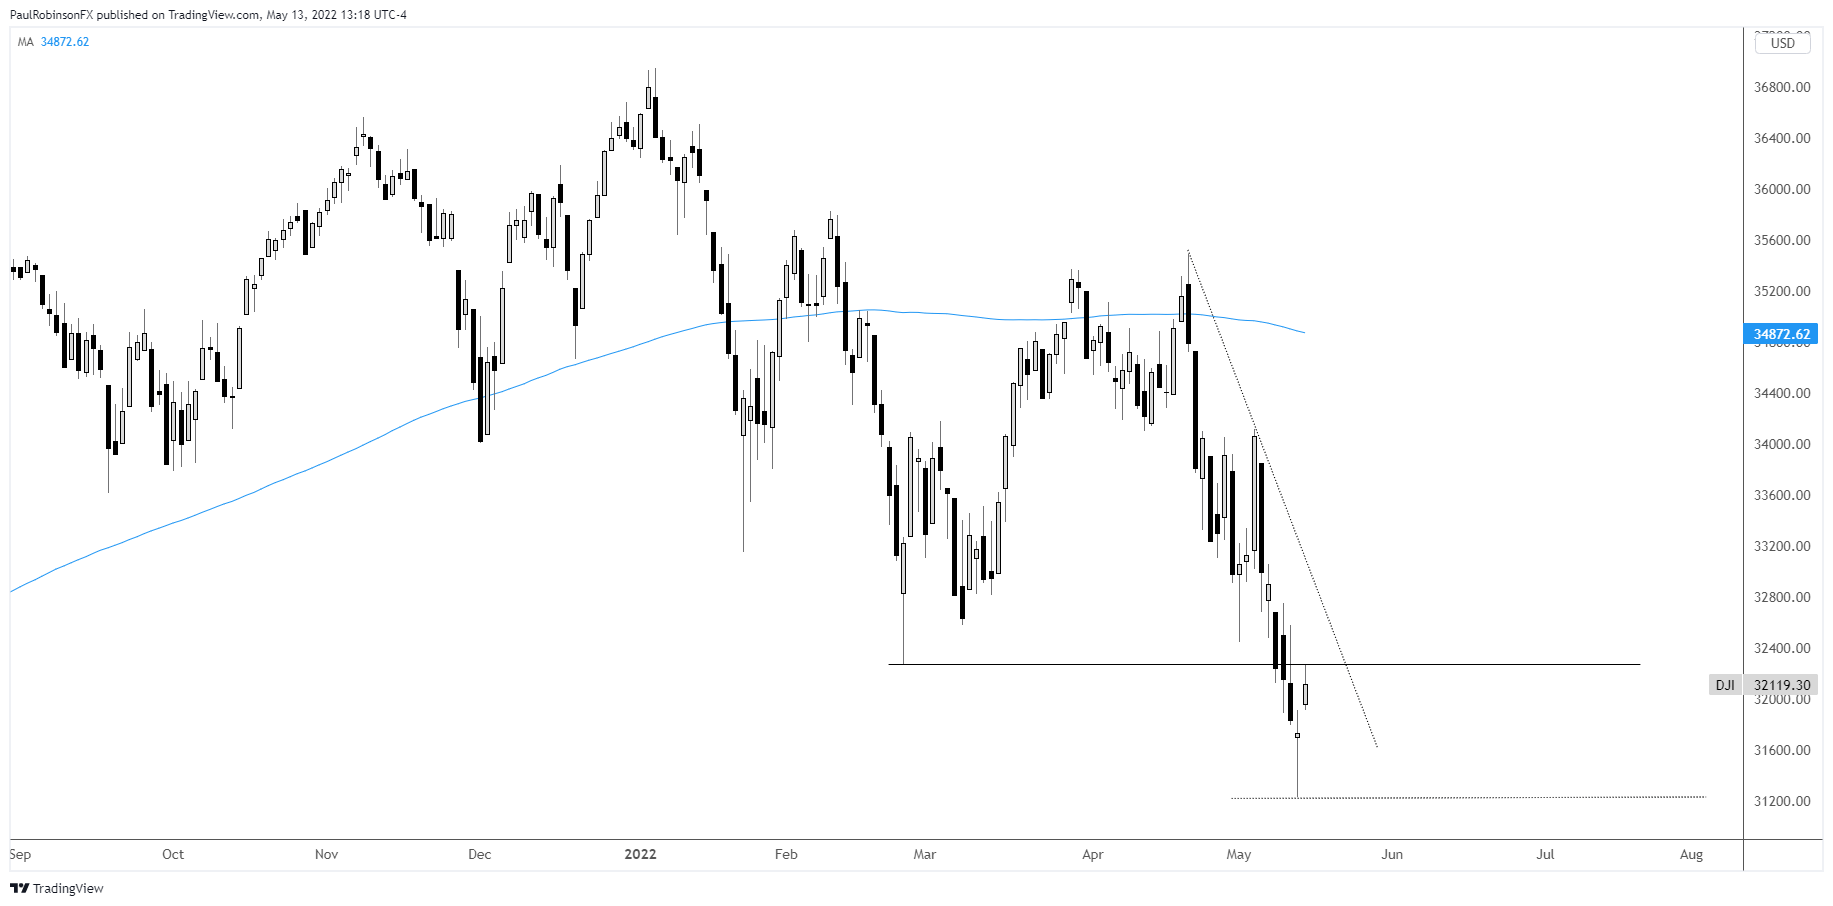
Dow Jones Chart by TradingView
Resources for Forex Traders
Whether you are a new or experienced trader, we have several resources available to help you; indicator for tracking trader sentiment, quarterly trading forecasts, analytical and educational webinars held daily, trading guides to help you improve trading performance, and one specifically for those who are new to forex.
---Written by Paul Robinson, Market Analyst
You can follow Paul on Twitter at @PaulRobinsonFX


