


US DOLLAR TECHNICAL OUTLOOK: BULLISH
- The medium-term trend of the US dollar index is undeniably bullish based on technical analysis
- Near-term price action is also constructive amid the development of a double bottom pattern
- The DXY could accelerate its advance and challenge the 101.00 level if key resistance in the 99.30/99.45range is invalidated
Trade Smarter - Sign up for the DailyFX Newsletter
Receive timely and compelling market commentary from the DailyFX team
Most read: US Dollar Struggles Despite Fed Hawks Screeching for Hikes. Where to for the DXY Index?
Over the past few days, volatility in the US dollar index (DXY) has moderated, with price attempting to consolidate around the 98.75 area. Despite the recent congestion, the 12-month trend remains bullish, as reflected on the daily chart below, where the index is making higher highs and higher lows sequentially, while being guided upwards by an impeccable ascending trendline extended off the May 2021 lows.
US DOLLAR INDEX (DXY) DAILY CHART

US Dollar Index (DXY) Chart Prepared in TradingView
Although medium-term technical signals are positive for the U.S. dollar, it is necessary to focus on a smaller time frame for clues to near-future direction and market bias. For this, the four-hour candlestick chart may be more useful. Zooming in to this timescale, we can see at first glance what seems to be the development of a double bottom, a bullish pattern that resembles the letter W.
As of Friday, the double bottom appears to be close to completion, but price needs to run a little higher. To confirm thischartist formation, we need to see a decisive push above resistance ranging from 99.30 to 99.45. If we see a sustained breach of this ceiling, DXY could be on its way to capture the 101.00 level, a measured target obtained by projecting the height of the pattern from the breakout point.

While the outlook for the US dollar is constructive for the days ahead, it is important to analyze the bearish scenario in case the market evolves unexpectedly. Having said that, if the bears resurface and trigger persistent weakness, the double bottom could be invalidated, in which case, we cannot rule out a test of confluence support near 97.75. From this area, the DXY could inflect to the upside, however, if sellers violate this floor, the decline could extend further, exposing the long-term trendline crossing the 96.30 region.
Next week brings many high-impact U.S. economic reports, including February PCE data, March ISM manufacturing results and the latest NFP figures. In light of the packed calendar, volatility is likely to pick up, setting the stage for large moves in the DXY index and financial markets in general.

US DOLLAR INDEX (DXY) FOUR-HOUR CHART
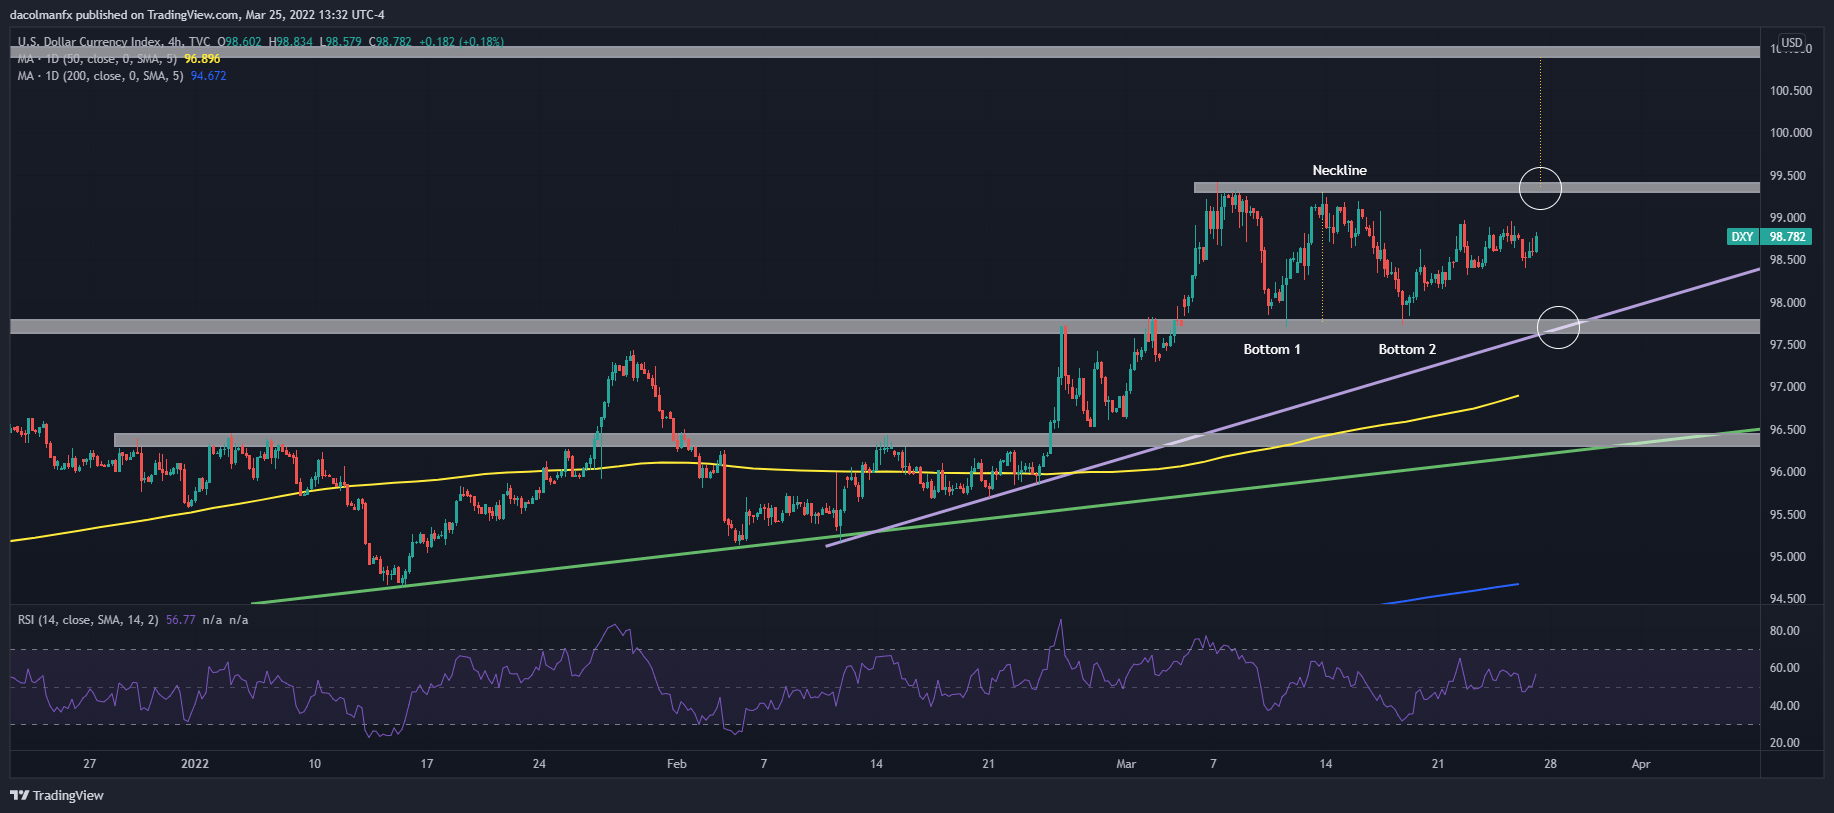
US Dollar Index (DXY) Chart Prepared in TradingView
EDUCATION TOOLS FOR TRADERS
- Are you just getting started? Download the beginners’ guide for FX traders
- Would you like to know more about your trading personality? Take the DailyFX quiz and find out
- IG's client positioning data provides valuable information on market sentiment. Get your free guide on how to use this powerful trading indicator here.
---Written by Diego Colman, Contributor


