


Indices Technical Forecast: Neutral to Bearish
- S&P 500 turning lower may signal top of corrective rally
- Nasdaq 100 finding difficulty around the 200-day MA
- Dow Jones holding up a little better than other indices, for now

S&P 500 Technical Forecast
The S&P 500 is weakening from the Feb 2 high and it is this price action that is helping create a ceiling around 4595 that may prove to be the end of the bounce. The rally is viewed as only a bounce, or corrective rally given the context of a market that looks like it may be in for another major leg lower in the weeks ahead.
A break below the 4451 level is viewed as being significant for accelerating the turn lower. This level marks both the Feb low and the 200-day moving average. The two technical thresholds are creating a strong level of confluent support.
If we see a breakdown below support the possibility of a maturing H&S pattern comes to the forefront with the right shoulder taking shape. It will still take a break of the neckline to fully trigger the pattern. For now, using both noted short-term levels as points of interest to potentially take action.
S&P 500 Daily Chart

Nasdaq 100 Technical Forecast
TheNasdaq 100 is rolling over from what could make up the right shoulder of a head-and-shoulders pattern. This is all coming after a decline out of the bull channel dating to September 2020. It may still take some time, but as long as in the near-term the NDX stays below the 200-day at 15055 and Feb 2 high at 15196, the outlook is neutral to negative.
Nasdaq 100 Daily Chart

Nasdaq 100 Chart by TradingView
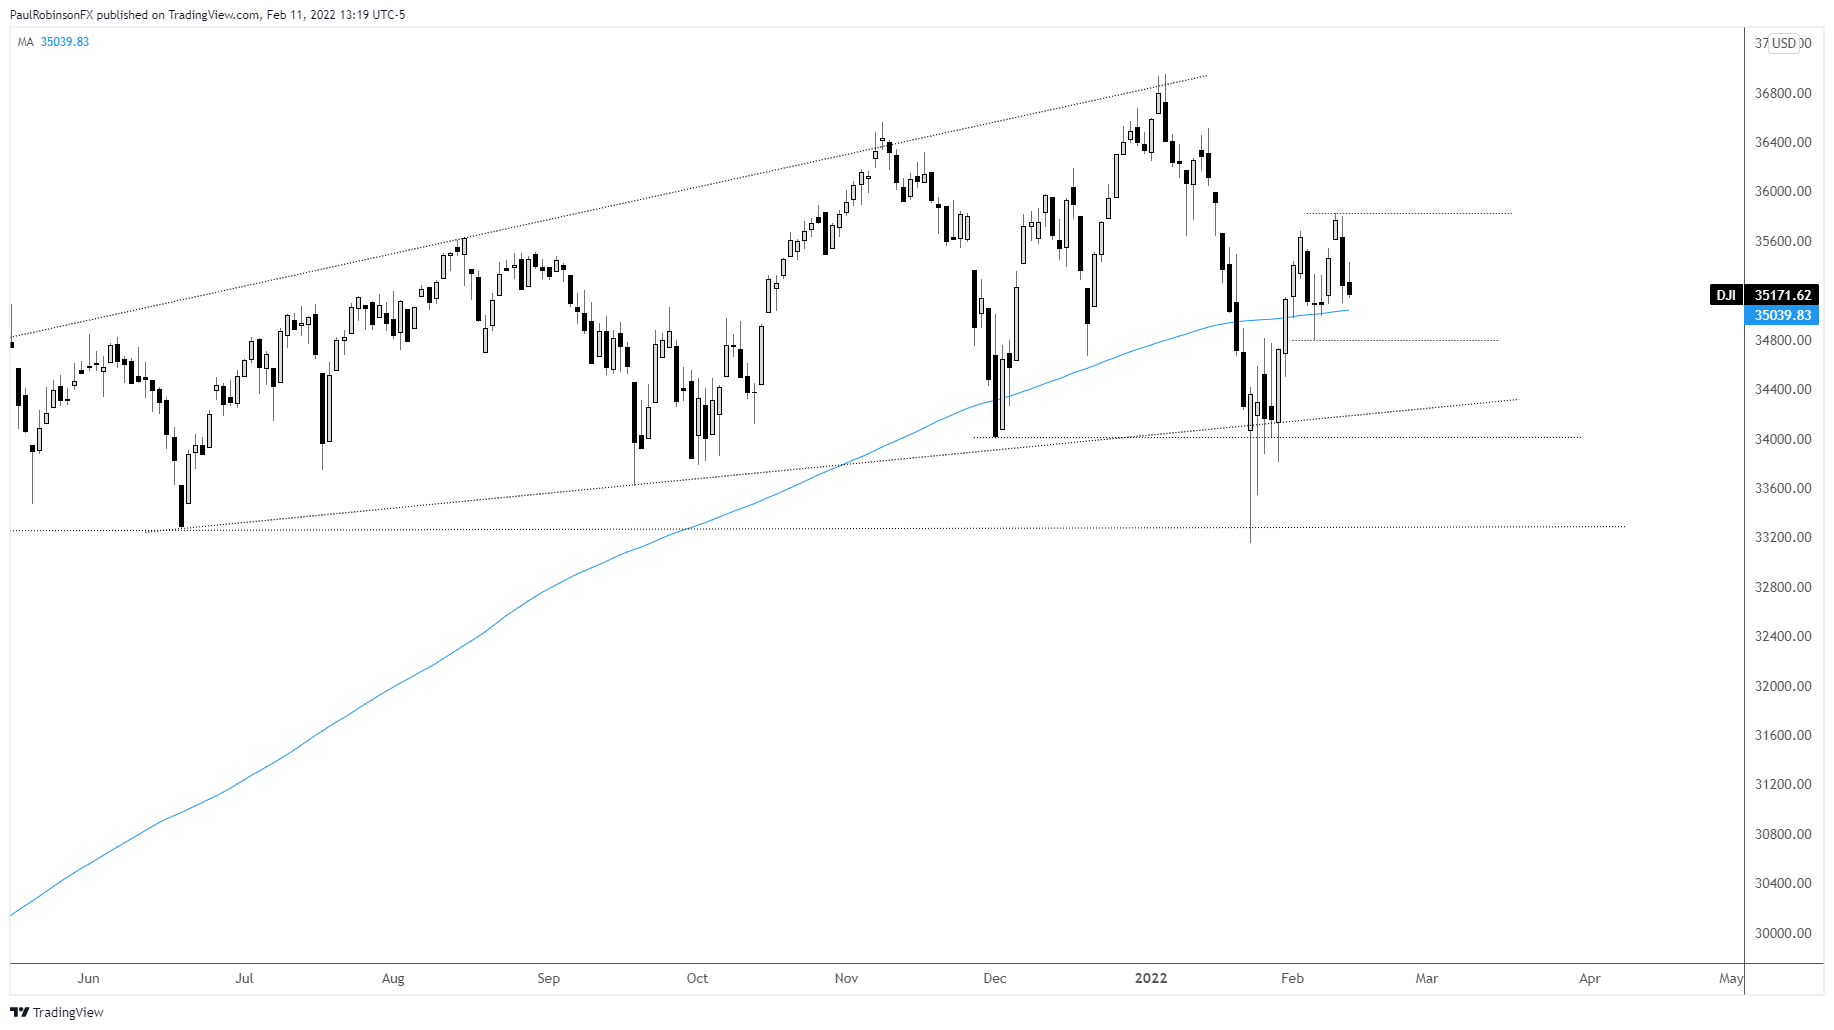
Dow Jones Technical Forecast
The Dow Jones continues to fare better than the SPX and NDX, but if we see a full-on risk-off event unfold soon, then the Dow will suffer big losses as well. For now, the near-term top-side level to watch is 35824 and near-term support is at 34799.
Dow Jones Daily Chart
Dow Jones Chart by TradingView
Resources for Forex Traders
Whether you are a new or experienced trader, we have several resources available to help you; indicator for tracking trader sentiment, quarterly trading forecasts, analytical and educational webinars held daily, trading guides to help you improve trading performance, and one specifically for those who are new to forex.
---Written by Paul Robinson, Market Analyst
You can follow Paul on Twitter at @PaulRobinsonFX


