


Australian Dollar, AUD/USD, AUD/JPY, AUD/CAD, EUR/AUD – Weekly Technical Outlook
- Australian Dollar weakened this past week against its key peers
- AUD/USD outlook remains bearish as AUD/JPY uptrend holds
- AUD/CAD extended losses, EUR/AUD remains range-bound

AUD/USD – Bearish
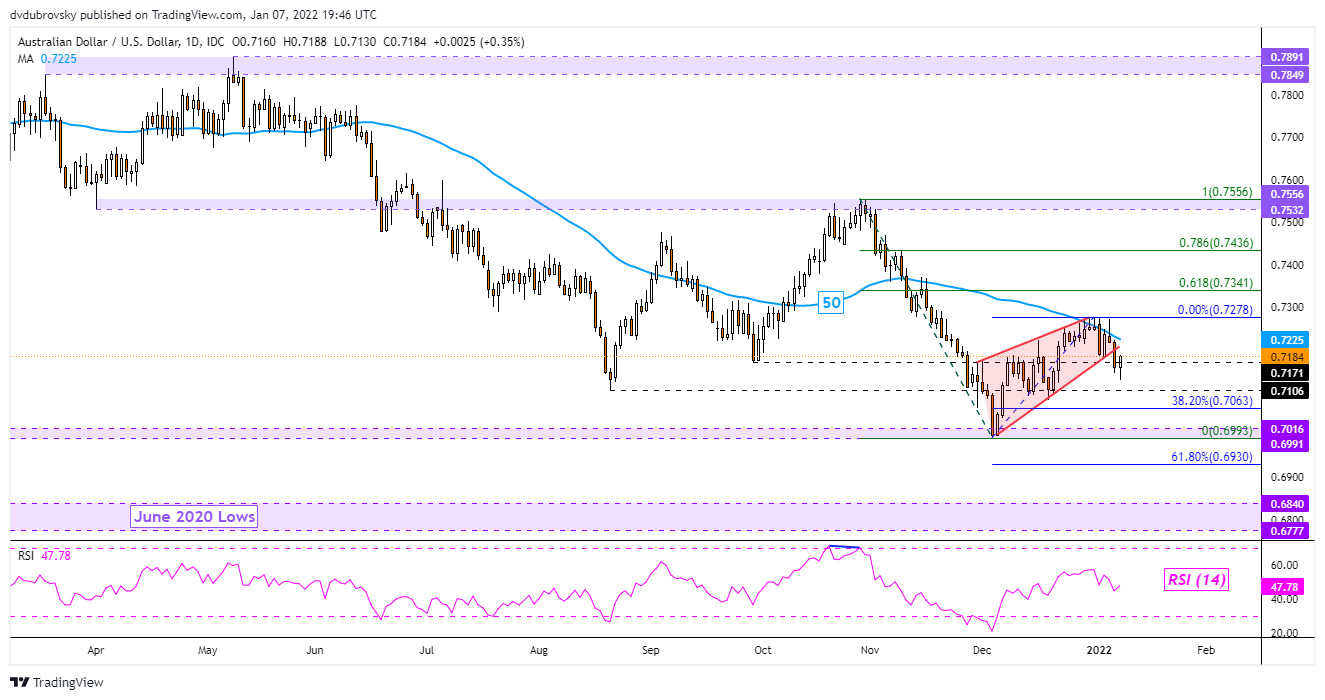
The Australian Dollar started off the New Year on a sour note against the US Dollar, with AUD/USD breaking under a bearish Rising Wedge chart pattern on the daily chart below. This may open the door to resuming the downtrend from late October through November. However, prices turned cautiously higher to round off the week. Still, the 50-day Simple Moving Average appears to be holding as key resistance, maintaining the broader downside focus that was seen throughout last year.
Extending losses places the focus on the key 0.6991 – 0.7016 support zone. Taking out the latter would expose lows from June 2020, making for another range of support between 0.6777 and 0.6840. On the flip side, a confirmatory daily close above the December high at 0.7278 may shift the technical outlook bullish, exposing the 61.8% Fibonacci retracement at 0.7341.

AUD/JPY – Bullish
The Australian Dollar remains on the offensive against the Japanese Yen despite some consolidation last week. AUD/JPY continues to trade within the boundaries of a Rising Wedge formation on the daily chart below. Since prices remain within the pattern, the outlook remains tilted to the upside. Meanwhile, a bullish Golden Cross formed between the 20- and 50-day Simple Moving Averages.
These lines may hold as support in the event of a turn lower, maintaining the near-term upward focus since December. Extending gains may see prices push towards the ceiling of the wedge, with the 78.6% Fibonacci retracement not too far above at 84.662. Beyond that sits the 2021 high at 86.261. In the event of a wedge breakout lower, that would likely shift the outlook bearish given confirmation. Key support seems to be the 82.028 – 81.657 inflection zone before the 23.6% level at 80.553.

AUD/CAD – Bearish
The Australian Dollar remains under pressure against the Canadian Dollar, with AUD/CAD selling off sharply this past week. This was in line with the dominant downtrend since 2021. Falling resistance from July was reinforced recently, shown via the red parallel lines on the daily chart below. The pair cleared the 0.9146 – 0.9114 inflection range, bringing the December low at 0.8972 closer in view.
Still, getting there entails clearing the midpoint of the Fibonacci extension at 0.9054. Extending losses below last year’s low would subsequently expose the 78.6% point at 0.8870. On the flip side, pushing above the December high at 0.9303 would increasingly shift the outlook bullish. Such an outcome would bring the September peak at 0.9377 in focus.

EUR/AUD – Neutral
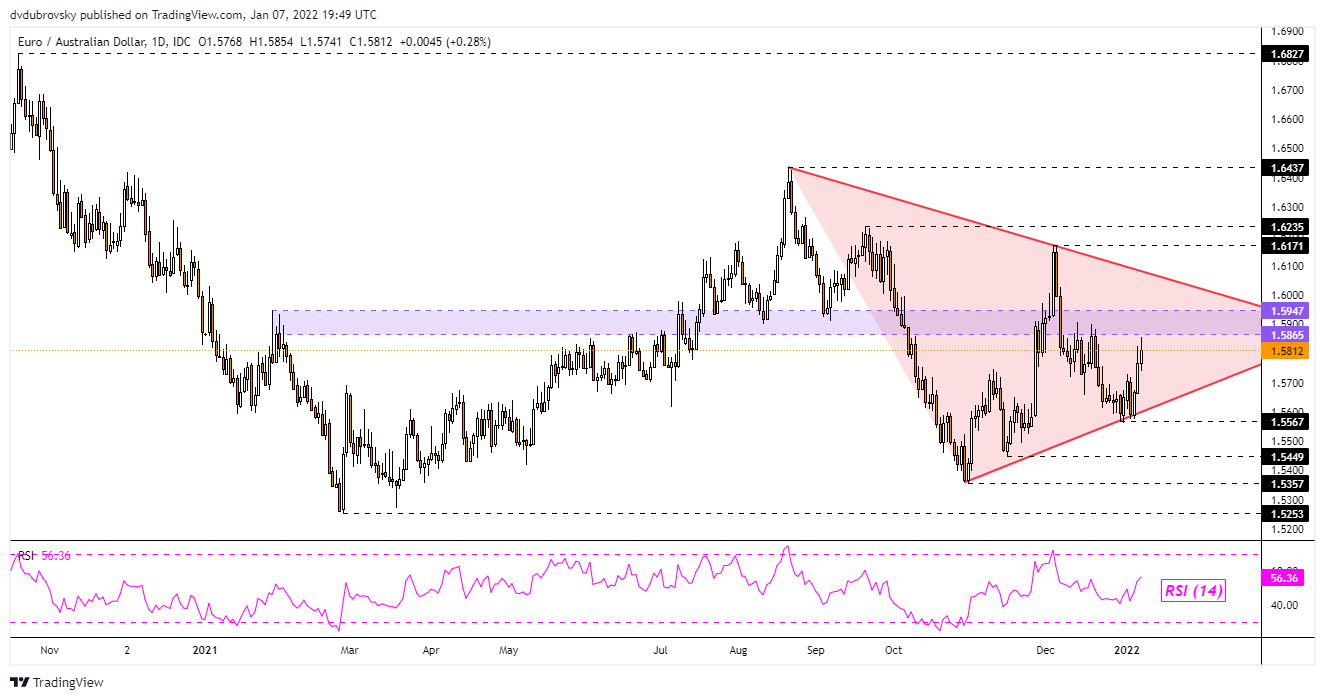
The Australian Dollar also succumbed to selling pressure against the Euro this past week. However, EUR/AUD remains in a consolidative state since last year on the daily chart below. Prices are trading within a Symmetrical Triangle chart pattern, which is typically a neutral formation. Until a breakout, prices may remain within the boundaries of the pattern, continuing to consolidate in directionless trade.
Given the latest bounce off the floor of the triangle, the 1.5865 – 1.5947 inflection zone is in focus as immediate resistance. Clearing that range would expose the ceiling of the triangle, which may hold as resistance. On the flip side, a turn lower and break under the pattern would place the December low at 1.5562 as key support. A breakout under the latter may confirm the triangle breakout, opening the door to extending losses.
--- Written by Daniel Dubrovsky, Strategist for DailyFX.com
To contact Daniel, use the comments section below or @ddubrovskyFX on Twitter


