


Indices Technical Forecast: Neutral to Bullish
- S&P 500 turning may consolidate before trying to break out
- Dow Jones looks poised for new record highs at some point soon
- Nasdaq 100 may struggle to climb around resistance

S&P 500 Technical Forecast
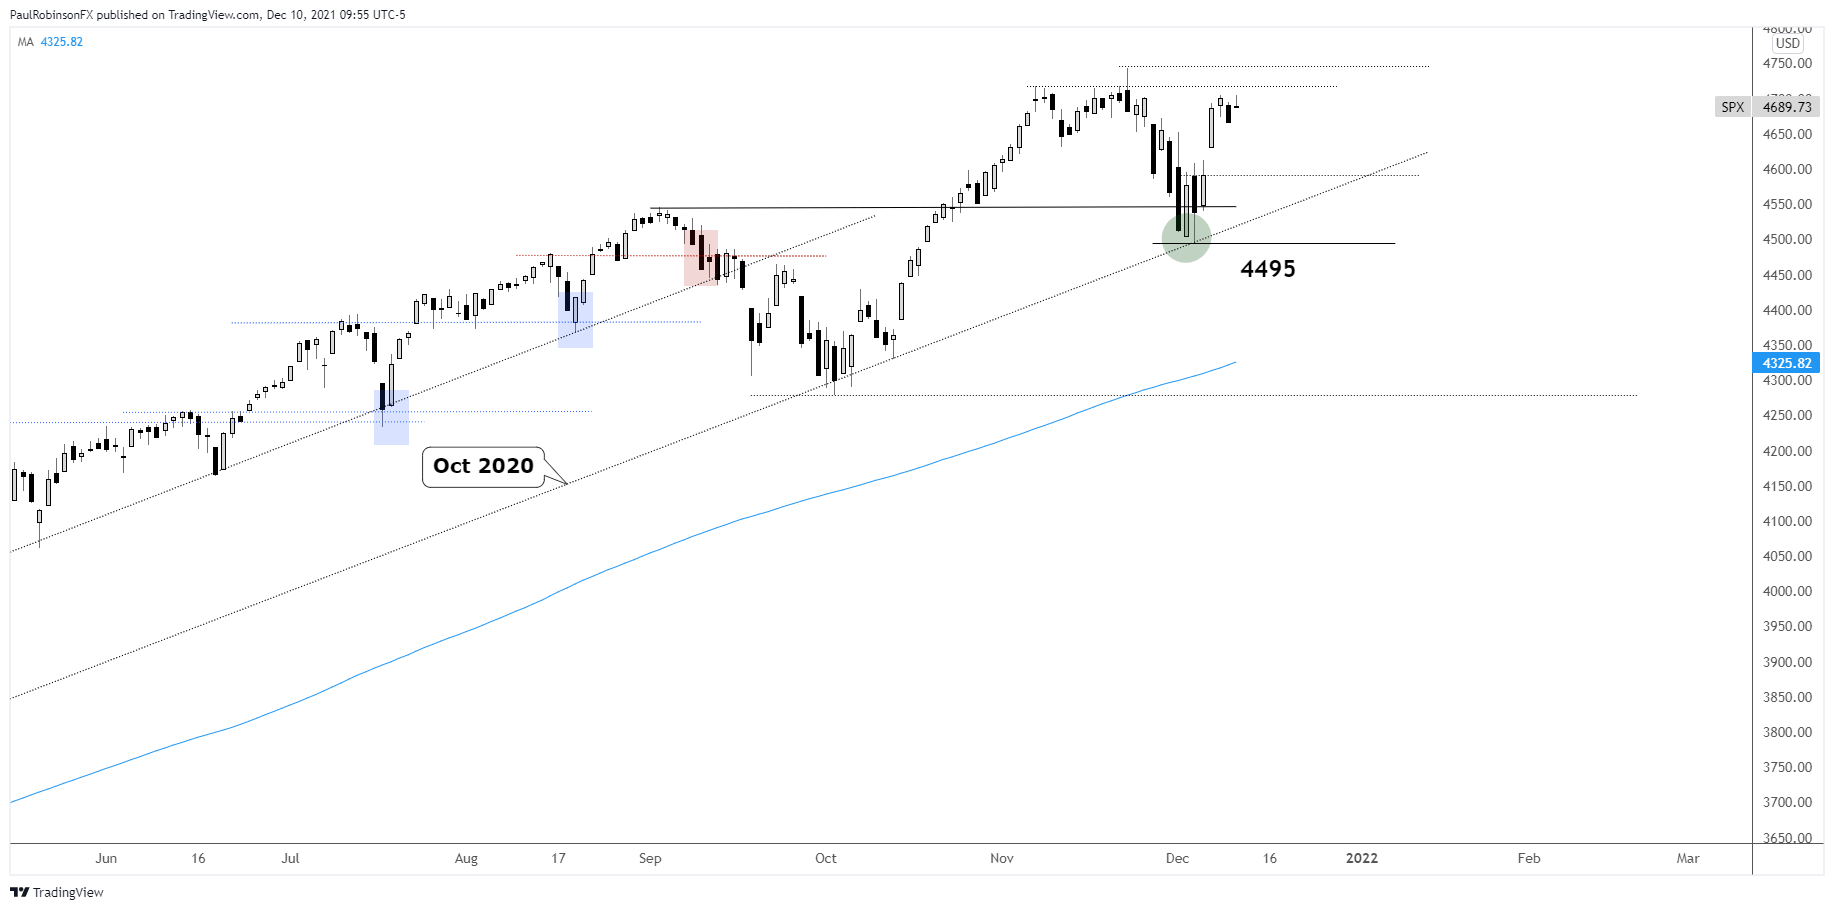
The S&P 500 is struggling around the old record high, and may continue to do so for a short while before seeing a sustained breakout. A sideways pattern would do the index some good for setting up a move higher.
The level to watch on the top-side is 4743. A break above it will have the SPX in fresh record territory. The key to trading a market at new record highs is to not get caught up chasing aggressively, as set-backs tend to occur not that long after new highs are recorded.
Should we see the market struggle in the days ahead, as long as it is mild then the outlook will remain neutral at worst. It will take a good bit of negative price action to flip the outlook convincingly bearish.
S&P 500 Daily Chart
Dow Jones Technical Forecast
The Dow Jones appears poised to trade to the record high at 35565 in the relatively near future. The strong surge from around the 200-day moving average is expected to taper off into a move with less momentum. If the old record is exceeded, just beyond it lies a trend-line running over from May. It could mark the upper threshold of a broadening top, but won’t become relevant without a big turn lower that breaks the bottom of the pattern. For now, it’s a scenario on the backburner, and higher levels are anticipated.
Dow Jones Daily Chart
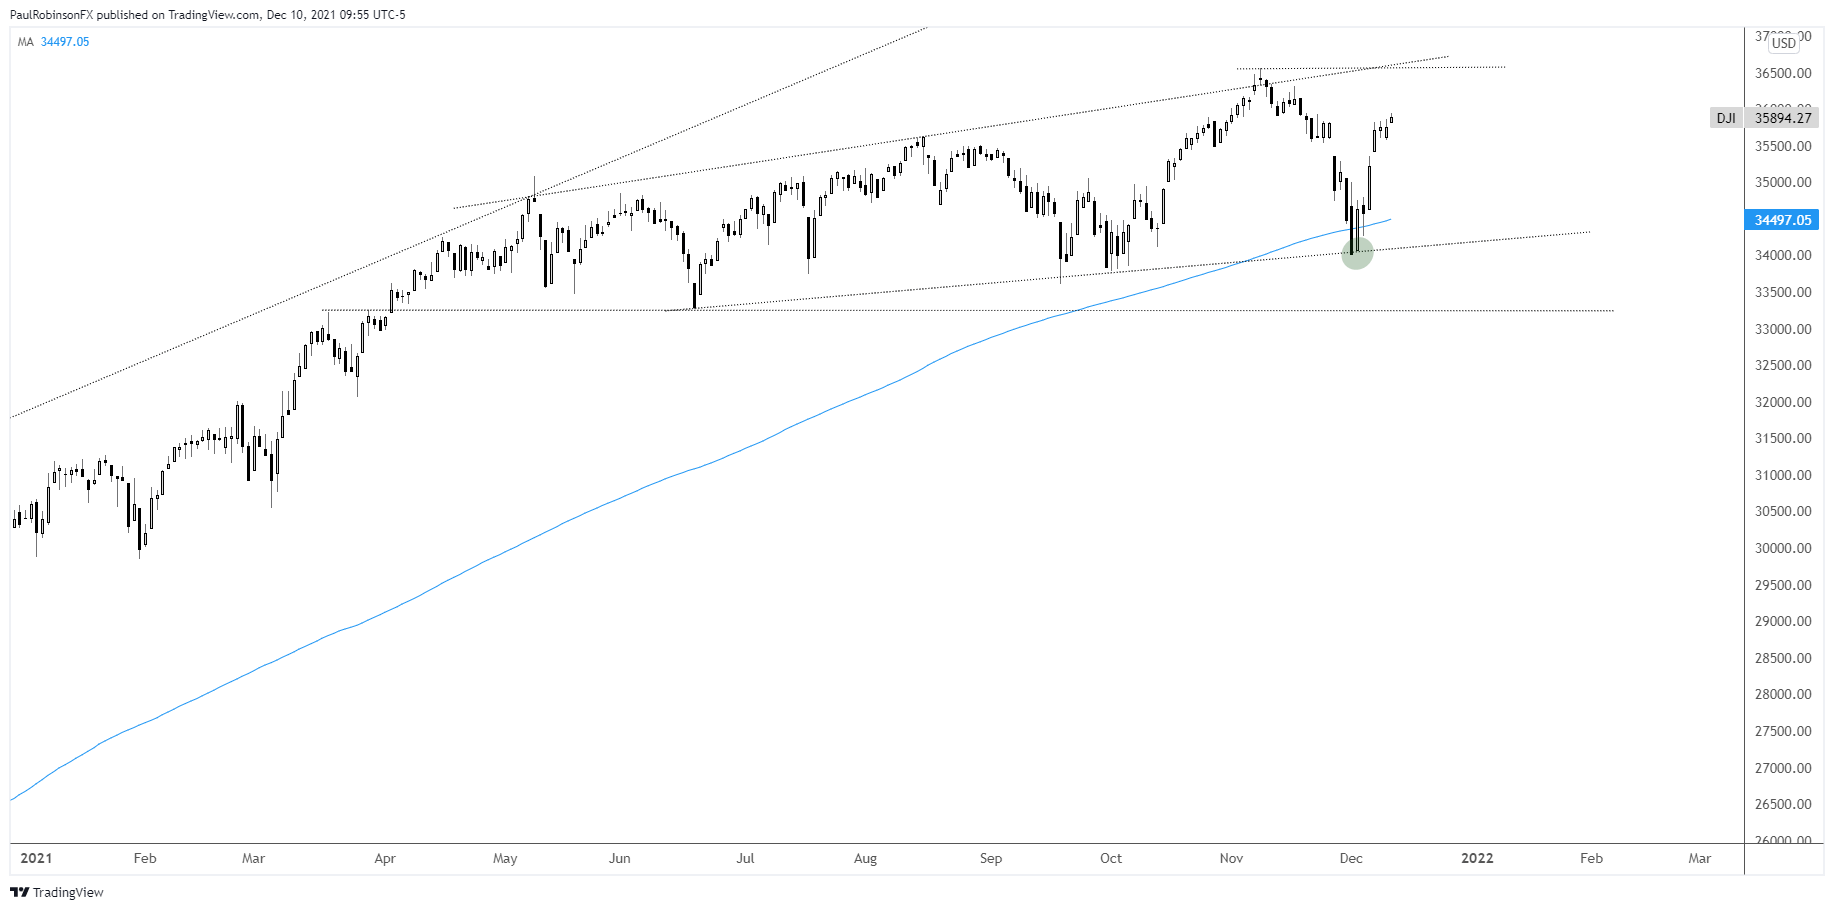
Dow Jones Chart by Tradingview
Nasdaq 100 Technical Forecast
The Nasdaq 100 continues to lag behind the S&P and Dow, and that may continue to be the case as the index struggles around the top of a rising bullish channel. Twice last month the NDX found problems just after arching over the top of the channel. If further weakness sets in watch for a gap-fill down to 15846, this could provide some support.
Nasdaq 100 Daily Chart
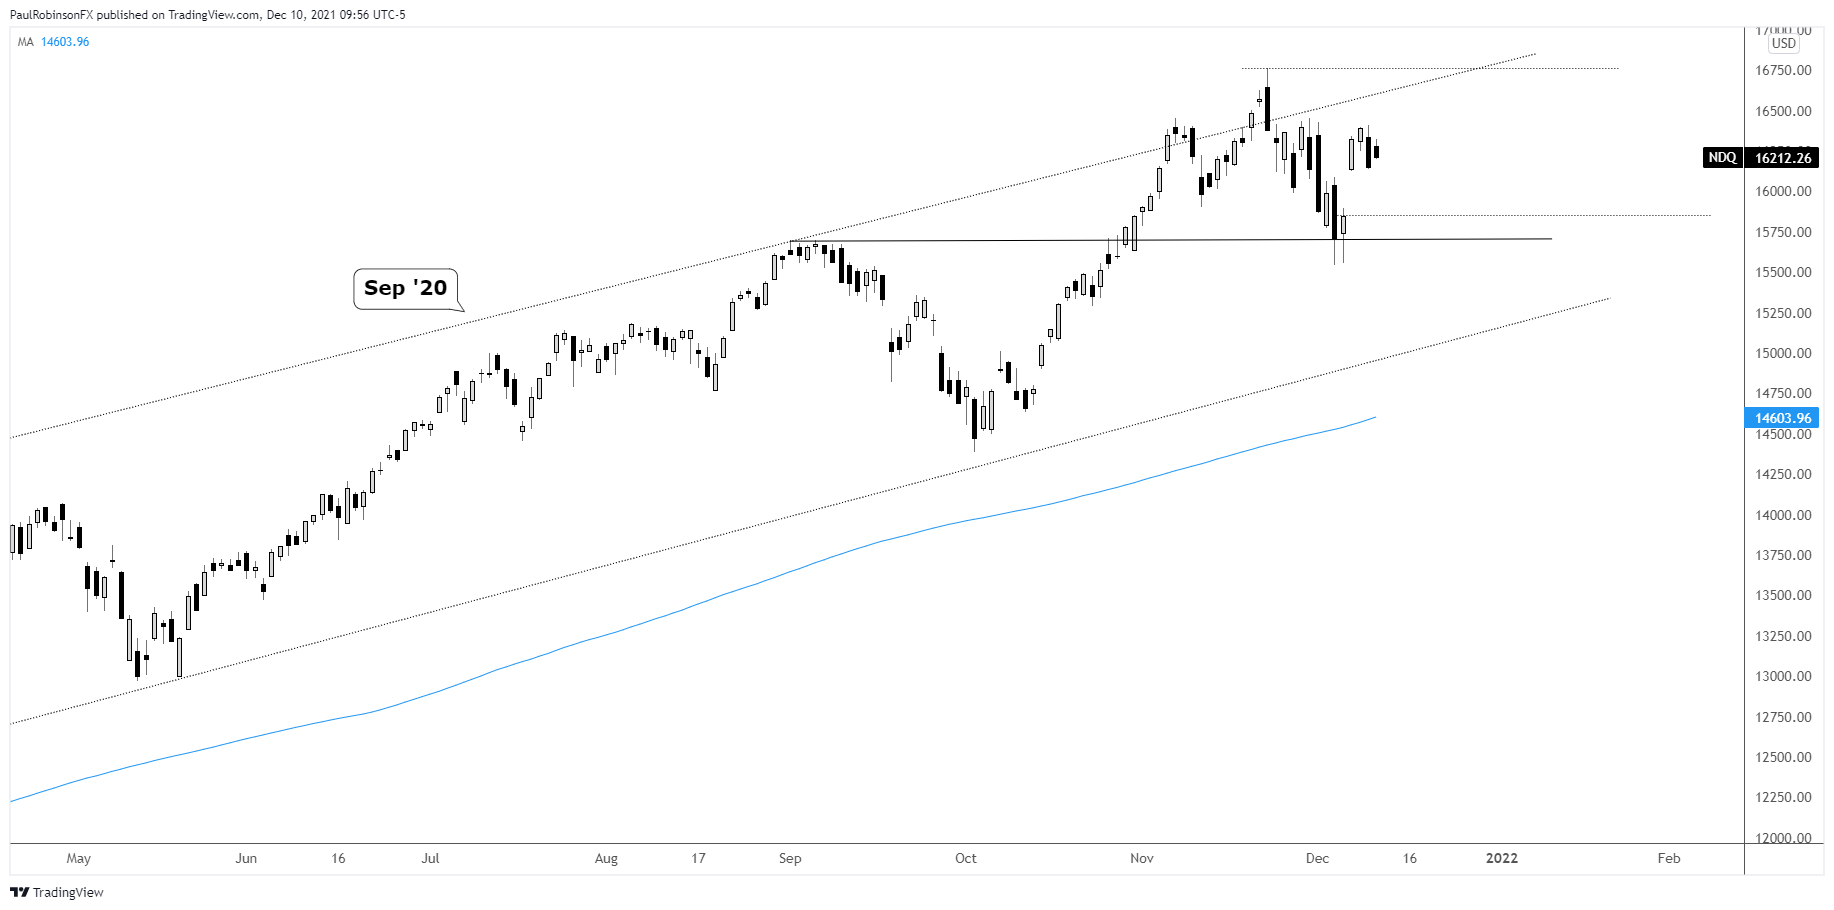
Nasdaq 100 Chart by Tradingview
Resources for Forex Traders
Whether you are a new or experienced trader, we have several resources available to help you; indicator for tracking trader sentiment, quarterly trading forecasts, analytical and educational webinars held daily, trading guides to help you improve trading performance, and one specifically for those who are new to forex.
---Written by Paul Robinson, Market Analyst
You can follow Paul on Twitter at @PaulRobinsonFX


