


Crude Oil Weekly Technical Forecast: Slightly Bearish
- Crude Oil Maintains its bullish bias but may see a pullback in the coming week if key zone of resistance holds
- The resemblance of a potential ‘head and shoulders’ formation suggests we could witness a major reversal in oil prices if confirmed.
Crude oil has witnessed elevated prices for the better part of 2H 2021 on the back of the global economic recovery which has taken place ever since the April 2020 low. However, oil had some difficulty surpassing the 2018 high at the historically important $86.67 area (highlighted with blue circles).
Crude Oil Monthly Chart Highlighting Major Inflection Points Over Time
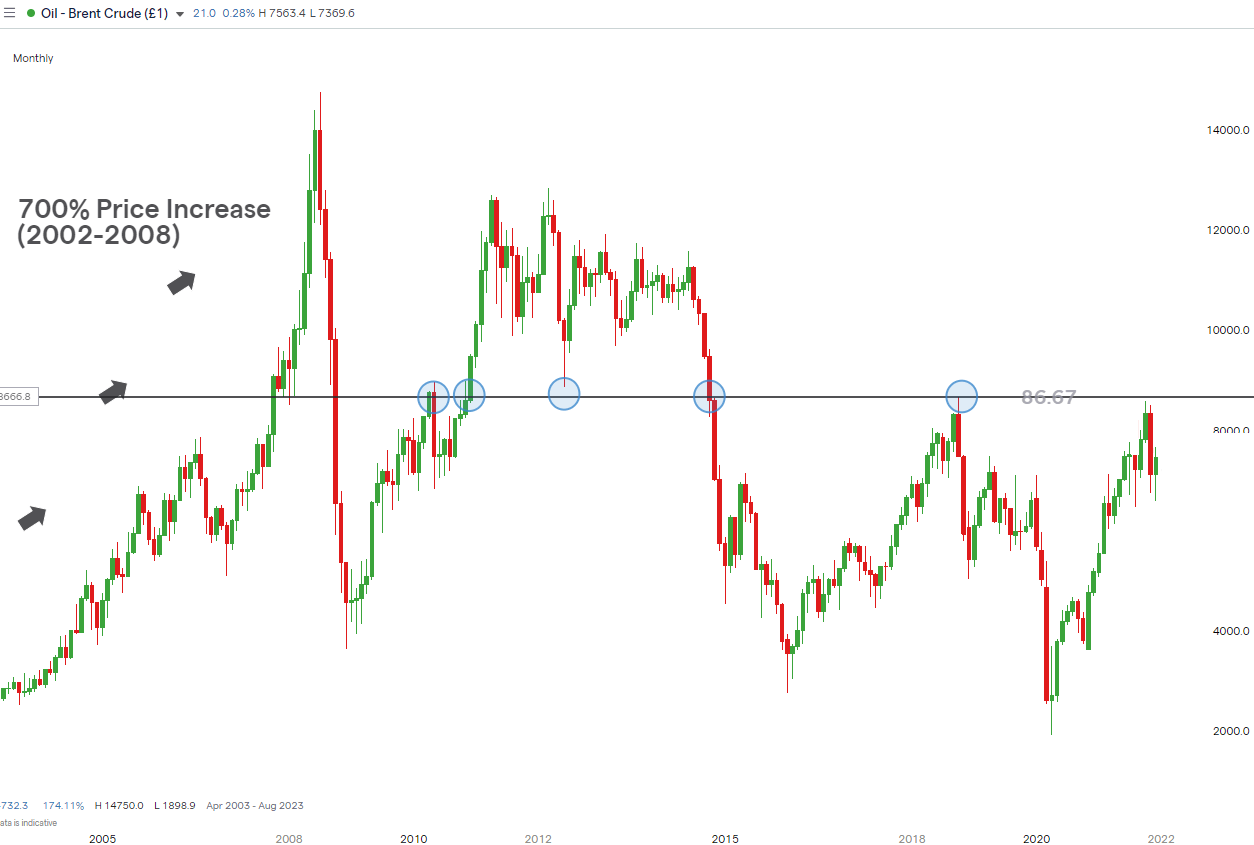
Chart prepared by Richard Snow, IG
Since then, oil has continued lower before bouncing off the ascending long-term trendline acting as support throughout the recovery. After a failed break beneath the trendline, last week witnessed an attempt to cover the massive sell-off which occurred due to fears of the then unknown Omicron variant.
Despite a continuation of the longer-term uptrend, the weekly chart reveals the potential for a major reversal as the early signs of a head and shoulders formation have appeared. If price action over the coming weeks builds out the ‘right shoulder’ we could start to see lower oil prices but the much lower neckline (around $65) means that traders may have to contend with the trade-off of potentially delaying short entries when looking for confirmation of the bearish reversal chart pattern.
Crude Oil Weekly Chart Showing Potential Head & Shoulders Formation

Chart prepared by Richard Snow, IG
Foundational Trading Knowledge
Forex for Beginners
Learn about the H&S and other Crucial Chart Formations
For the time being, crude oil remains largely in line with the long-term bullish trend but shorter-term direction may favor a pullback towards the long term ascending trendline if the $75.50 – $76.35 zone of resistance proves too much to handle. Relevant levels of support can be identified as $72.65 and $71.00 flat.
The ATR, coming off a recent high supports a continuation of the shorter-term downtrend as normalized volatility favors the existing trend. The 20 EMA is still below the 50 and 100 EMAs respectively, which adds to the current bearish bias over the shorter term.
Crude Oil Daily Chart Showing Levels to Watch
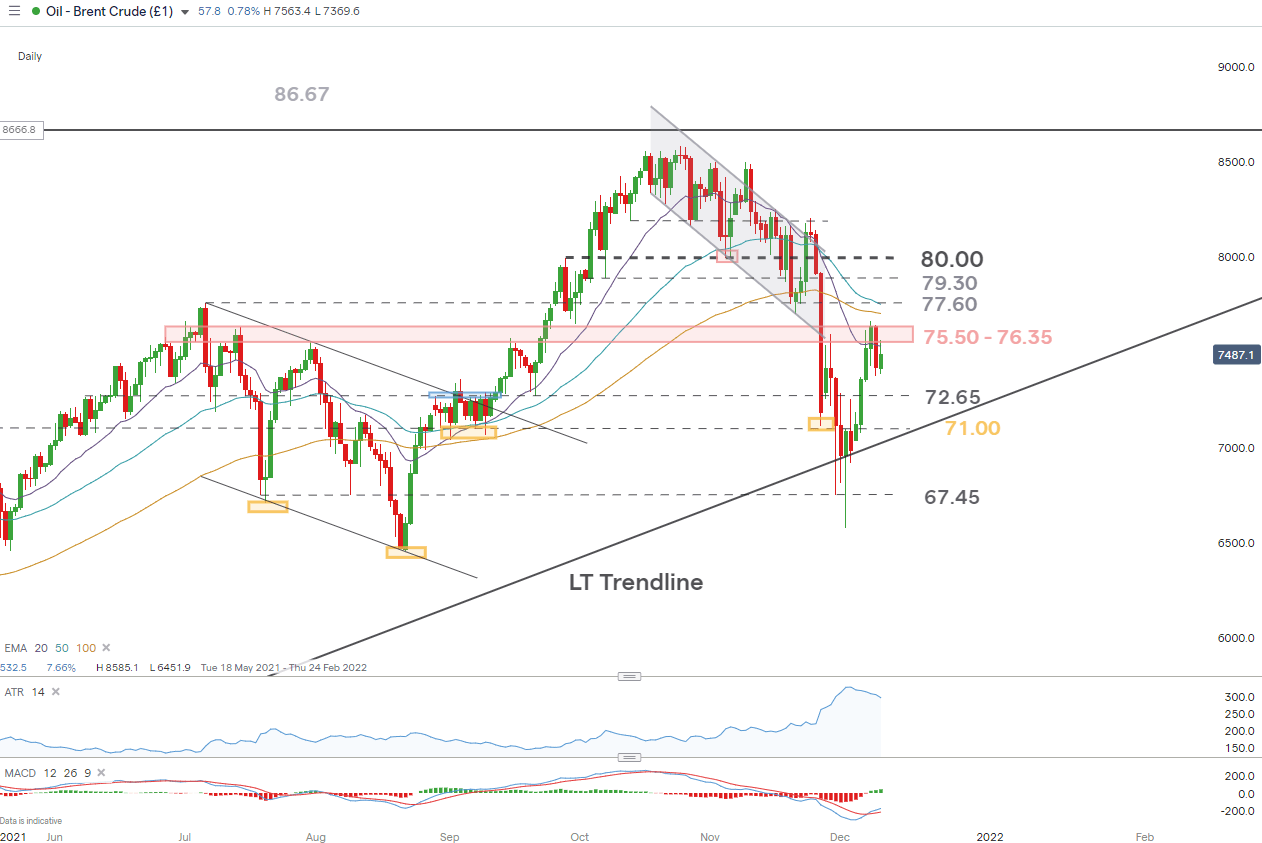
Chart prepared by Richard Snow, IG
A bullish move beyond the zone of resistance would result in $77.60 and $79.30 as the relevant levels of resistance on the way to the psychological level of $80.
Trade Smarter - Sign up for the DailyFX Newsletter
Receive timely and compelling market commentary from the DailyFX team
--- Written by Richard Snow for DailyFX.com
Contact and follow Richard on Twitter: @RichardSnowFX


