


Indices Technical Forecast: Neutral
- S&P 500 taking a breather, may consolidate
- Dow Jones backing off, watch summer high for support
- Nasdaq 100 backing off top of channel line from last year

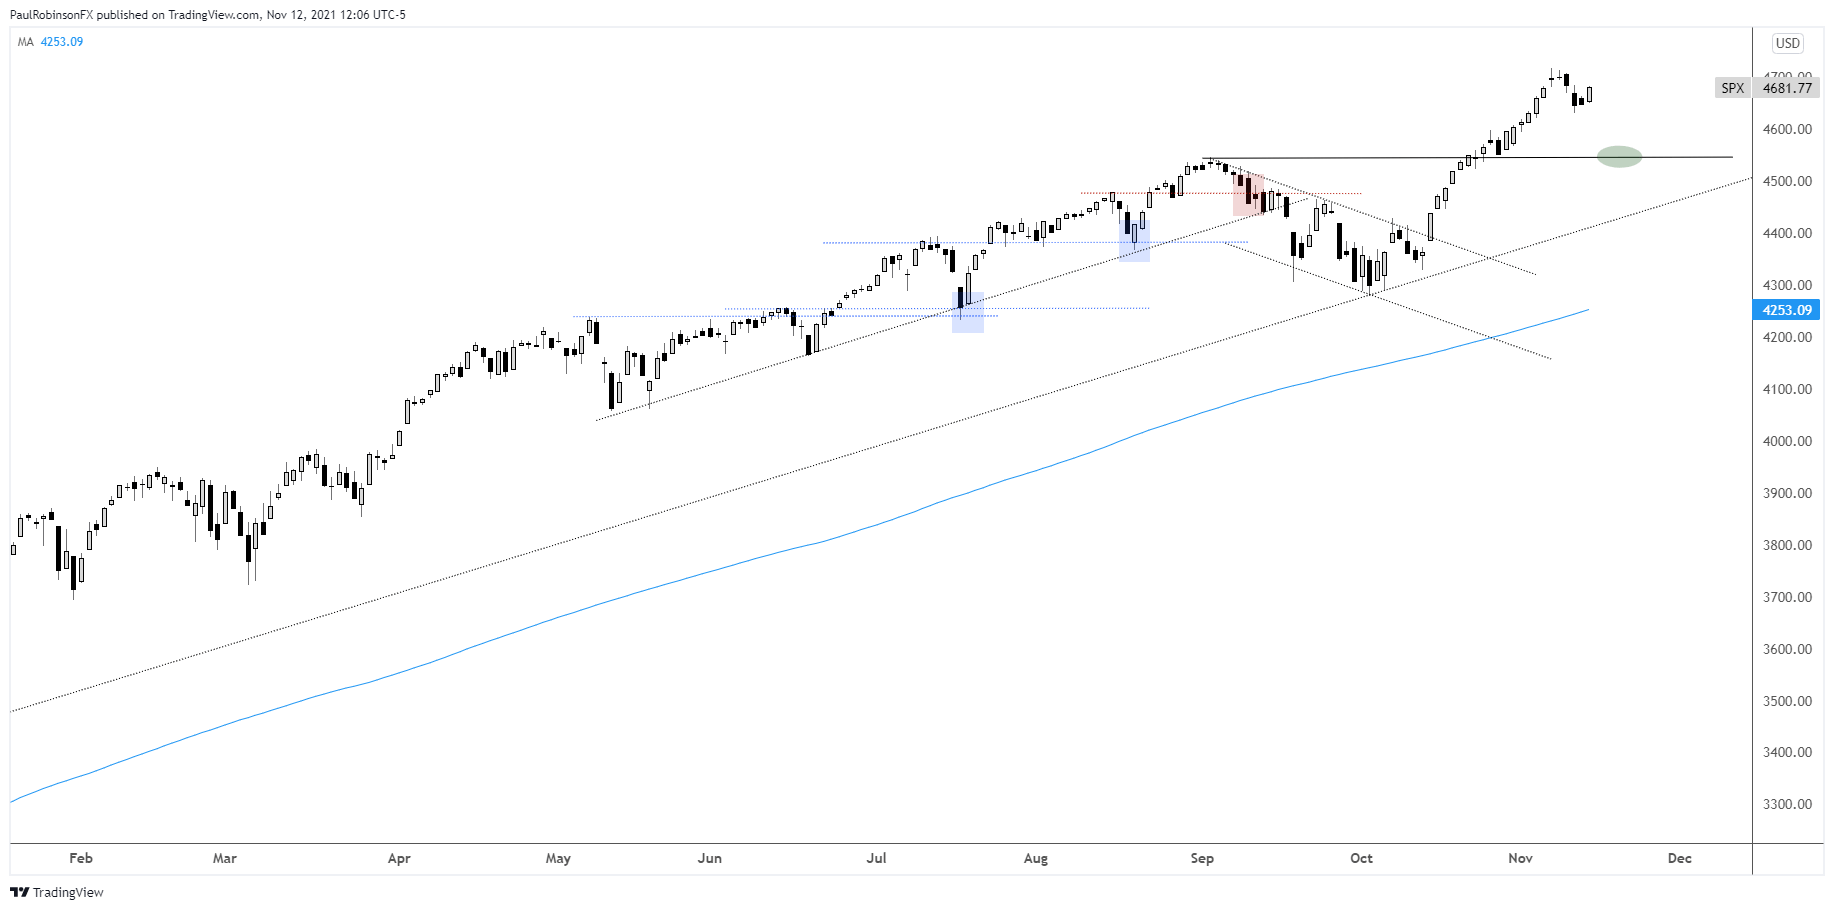
S&P 500 Technical Forecast
The S&P 500 finally took a breather last week after rushing higher over the past several weeks. At this time it could merely be a small corrective pattern developing, but it will be prudent to take a ‘wait-and-see’ approach.
A small consolidation pattern may offer would-be longs an opportunity to enter with the trend. Ideally, it would take through much or all of this coming week to form, so a solid base can form giving the market its best shot at tacking on sustainable gains.
If we see more selling come in, then eyes will turn towards the 4545 high created in early September. We have seen the market test prior highs before turning back higher, this could become the case once again.
S&P 500 Daily Chart
Dow Jones Technical Forecast
The Dow Jones is of course in pullback mode with the broader market. The level to watch on further weakness is 35631, the record high set in the summer. A hold there could provide traders with an opportunity to buy the dip and have a backstop to set stops.
Dow Jones Daily Chart
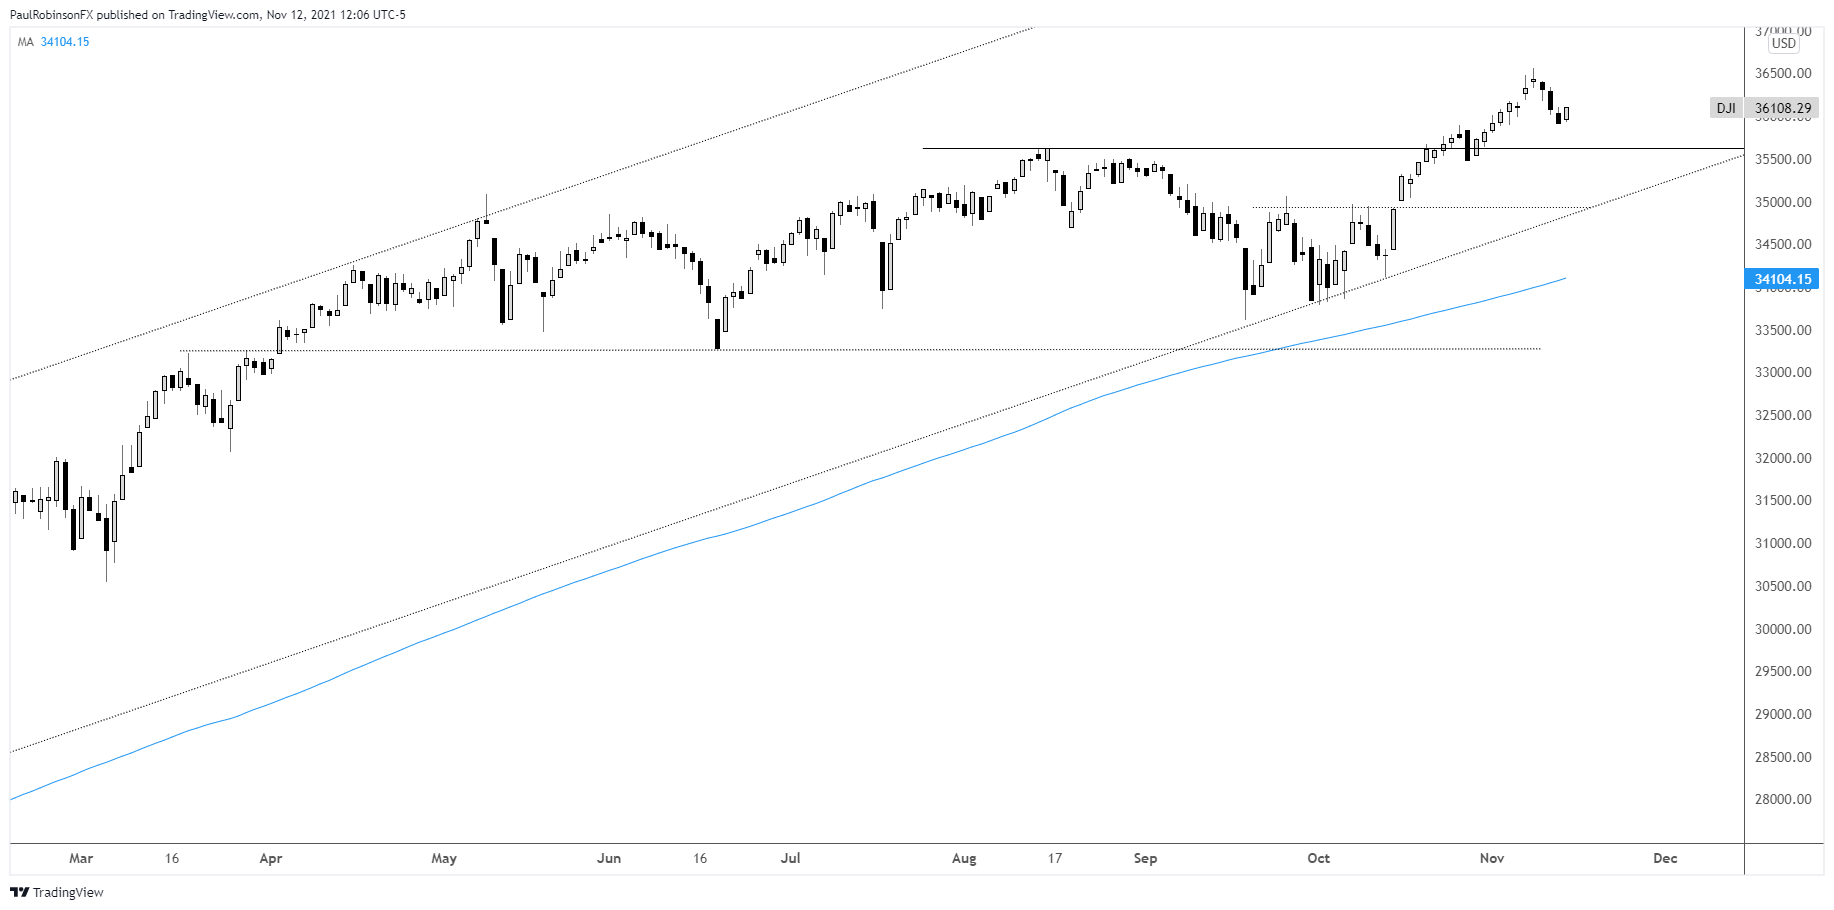
Dow Jones Chart by Tradingview
Nasdaq 100 Technical Forecast
The Nasdaq 100 briefly snuck above the top-side channel line extending back to September of last year. Hanging out around the top of the channel and forming a consolidation pattern could be a good sign that the NDX wants to eventually escape the gravity of the channel and accelerate even further.
It could be a bit of a challenge crossing this threshold with conviction and further weakness may be in store first. If this is the case, then watch how the prior record set in early September holds – that level is 15701.
Nasdaq 100 Daily Chart
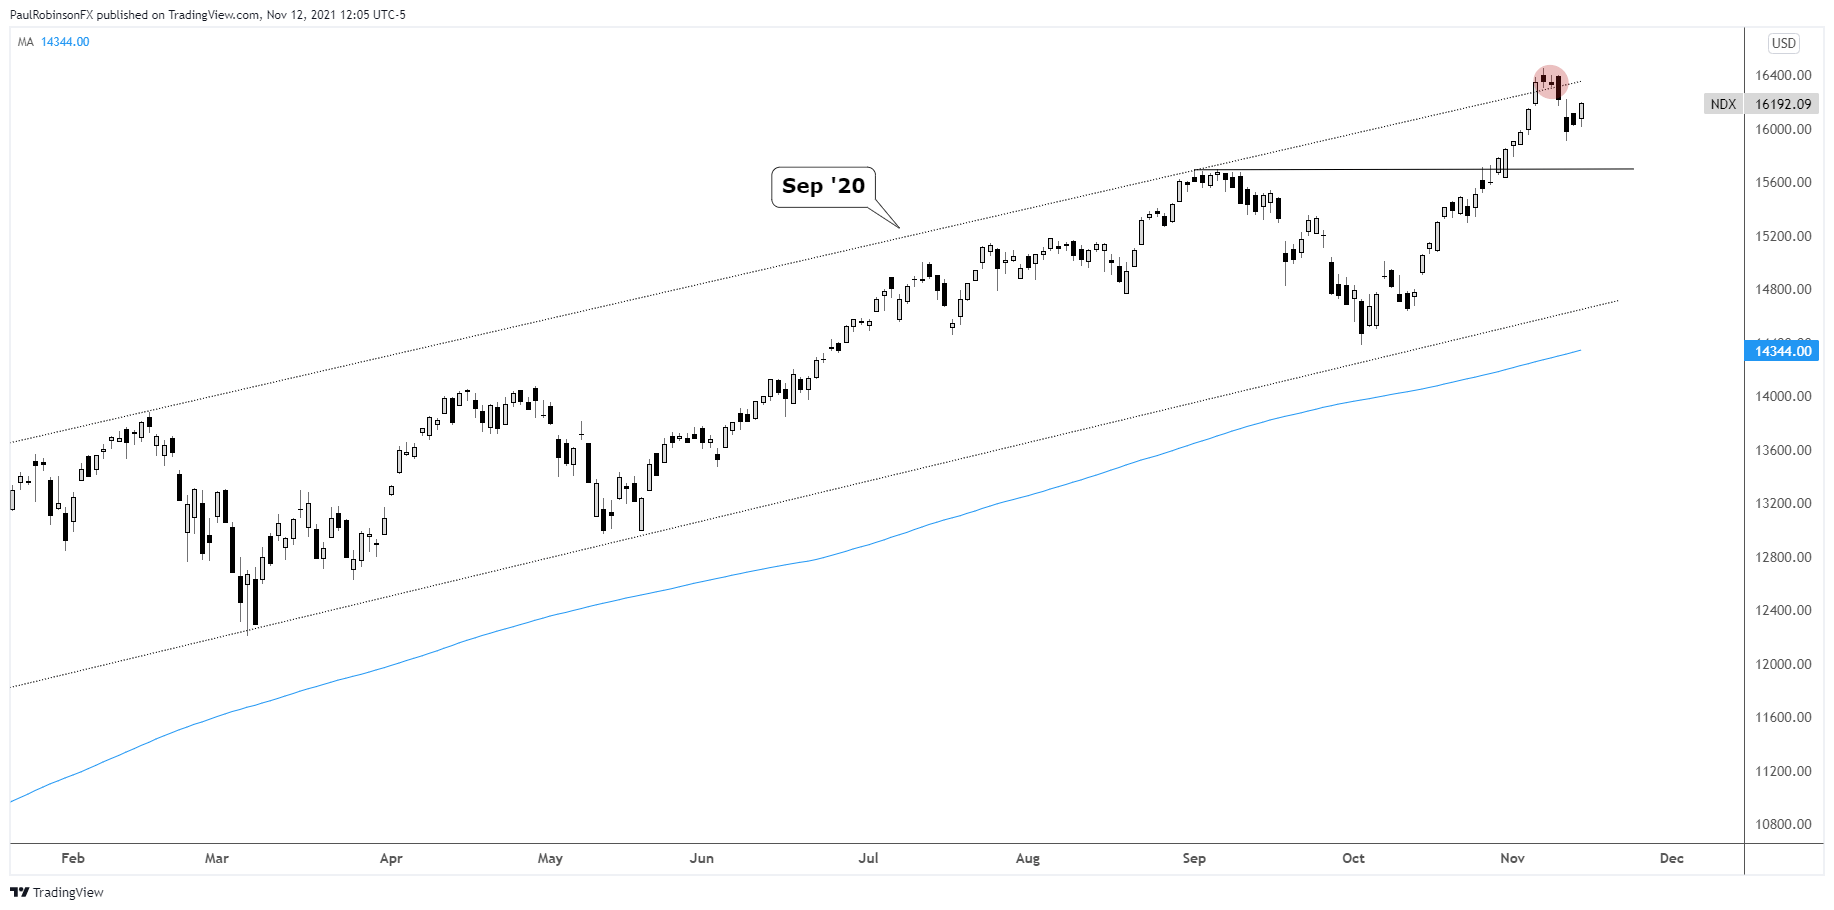
Nasdaq 100 Chart by Tradingview
Resources for Forex Traders
Whether you are a new or experienced trader, we have several resources available to help you; indicator for tracking trader sentiment, quarterly trading forecasts, analytical and educational webinars held daily, trading guides to help you improve trading performance, and one specifically for those who are new to forex.
---Written by Paul Robinson, Market Analyst
You can follow Paul on Twitter at @PaulRobinsonFX


