


USD Technical Outlook:
- US Dollar Index (DXY) is trading at a big long-term level
- Watch how price unfolds for further cues

US Dollar Technical Forecast: DXY Testing Major Resistance
The US Dollar as per the DXY is testing a major level as it heads into the new week. The area right around 94.67 encompasses the March 2020 low that was later validated as a meaningful level back in September 2020 when it was tagged as resistance.
It was further validated last month when price fell just shy of the level. This coming week will be all about whether the DXY can finally rally through resistance or not. Keep a close eye on momentum and whether a solid daily close above resistance can get price into open space.
If that happens, then we could see the DXY continue to extend higher towards 95.71, a swing-low created during June 2020, and the top-side trend-line running over peaks since June of this year. It could make for an interesting intersection of resistance to watch at some point soon.
If we see a strong reaction here, a turnabout that sends momentum swiftly lower, then the trend-line from May could become a focal point. For now, as long as that trend-line holds, the intermediate-term outlook will be viewed as neutral to bullish even if resistance keeps a lid on the DXY.
From a tactical standpoint, there a few ways to look at this. For those long from lower levels, it may be prudent to see first if resistance can break before looking to take profits or exit longs. A breakout may offer up a chance to take advantage of a fresh round of buying. For would-be longs, buying into resistance is what I call a “technical no-no”, so waiting for a confirmed breakout, and perhaps a pullback that validates the breakout, may be the best way to proceed.
For would-be shorts, a quick reversal trade may present itself here, but keep in mind the trend-line rising up from the May low – support is to be trusted until broken, especially when it arrives within the context of an uptrend.
US Dollar (DXY) Daily Chart
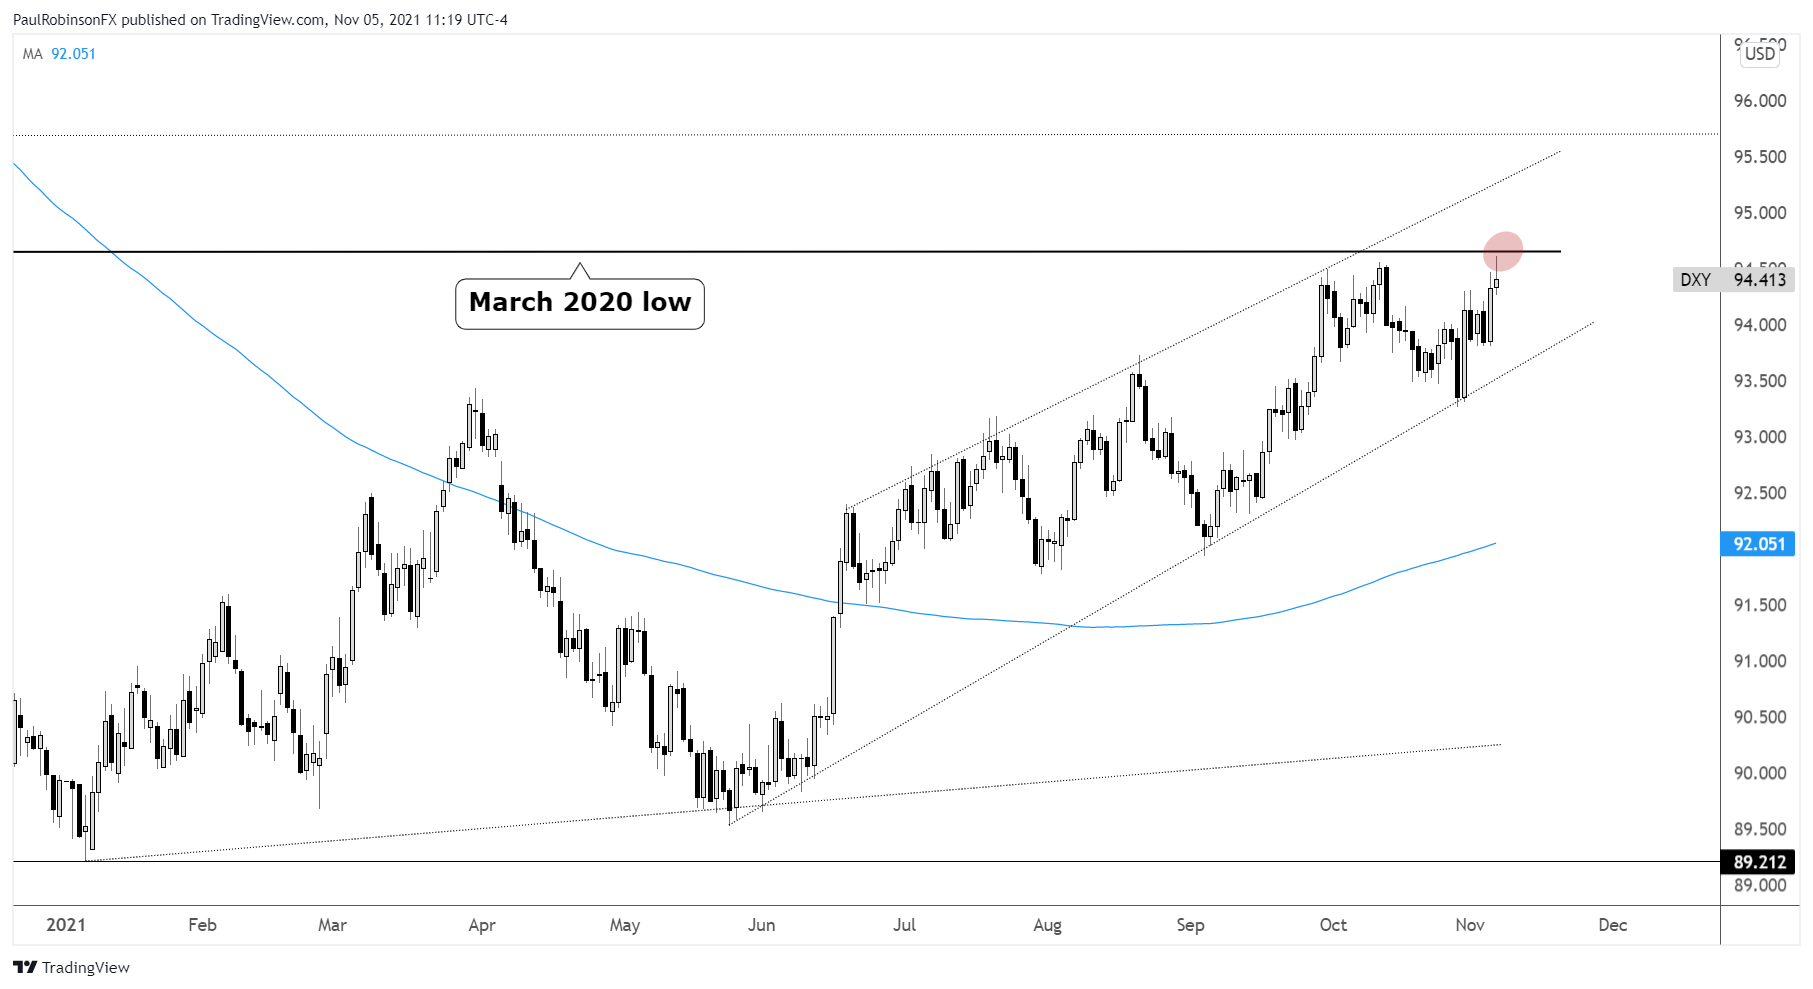
US Dollar Index (DXY) Chart by TradingView
Resources for Forex Traders
Whether you are a new or experienced trader, we have several resources available to help you; indicator for tracking trader sentiment, quarterly trading forecasts, analytical and educational webinars held daily, trading guides to help you improve trading performance, and one specifically for those who are new to forex.
---Written by Paul Robinson, Market Analyst
You can follow Paul on Twitter at @PaulRobinsonFX


