


AUD/USD Analysis:
- Headwinds for continued bullish AUD/USD price action in sight
- Institutional positioning reveals heavy bearish sentiment for Aussie dollar
- Risk events: US core inflation, FOMC minutes and Aus employment data

Current Bullish Momentum Running out of Steam?
It’s becoming increasingly more difficult to make a bullish case for AUD/USD despite the pair trading higher for the month of October thus far. This is mainly due to the long term bearish reversal pattern (head and shoulders) that played out within the H2 2021 and lack of bullish follow through in the 3Q and October.
While this is a technical forecast it would be remiss of me not to mention the current challenges/risks to the Chinese economy (major trading partner for Australia) via the heavily indebted Evergrande situation and general slow-down in economic conditions in the world’s second largest economy as restrictions on power usage are likely to trim growth.

The daily chart shows price right in-between the 76.4% and 61.8% Fib levels of the large 2018 – 2020 move, struggling to break above the zone of resistance between 0.7300 and 0.7315. Further bullish resistance appears in the form of the descending trendline and overbought status on the stochastic indicator which may cap any short term AUD/USD appreciation.
Disappointing NFP numbers on Friday resulted in a drop in the USD, observed in the US Dollar Index (DXY), which lifted AUD/USD ever so slightly, however, this looks likely to simply result in an extended period of consolidation as a strong directional move is yet to present itself.
In the absence of any large moves of intent or surprises, AUD/USD could trade next week between 0.7340 0.7260, extending this period of consolidation.
AUD/USD Daily Chart
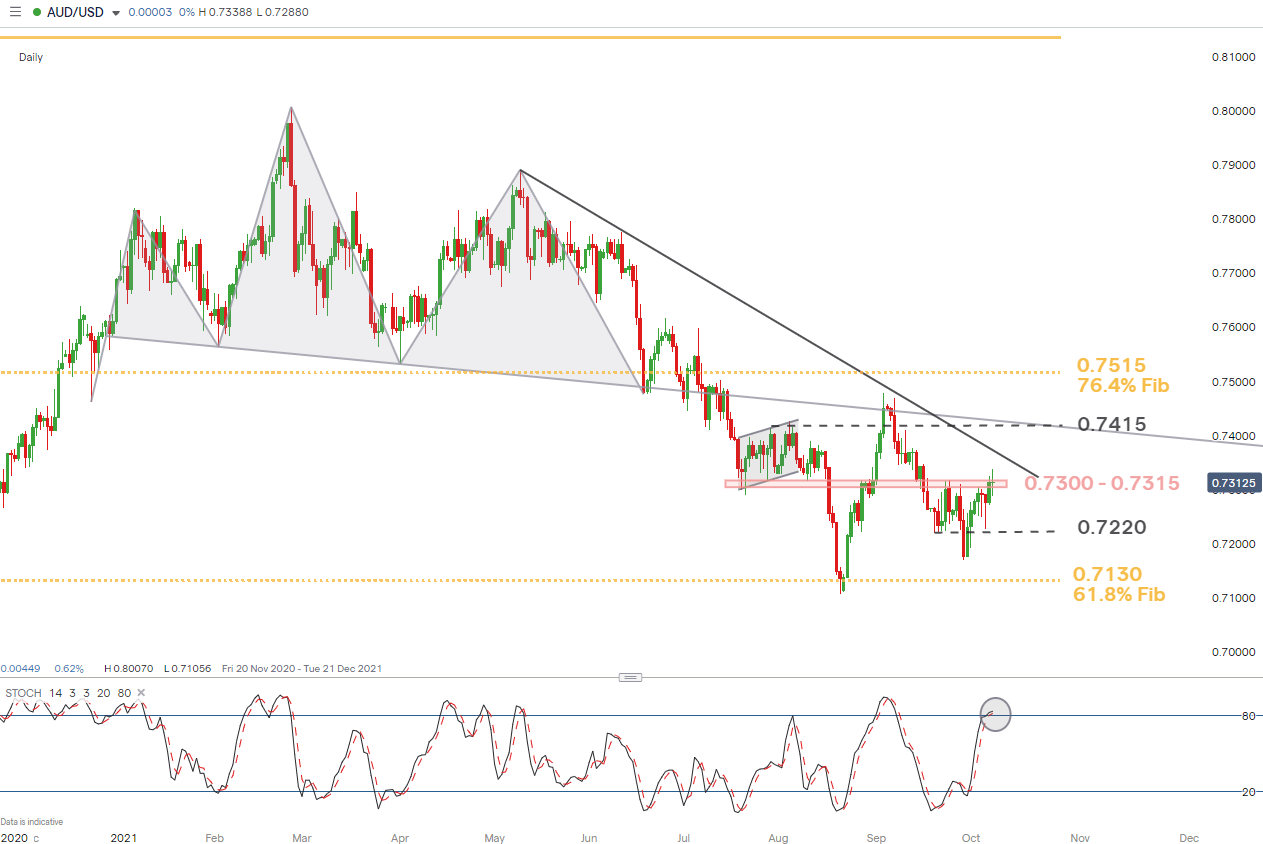
Chart prepared by Richard Snow, IG
Positioning and Sentiment
Aggregate USD positioning versus the Aussie dollar (as a percentage of open interest) paints an extremely bearish picture as the AUD comes in at -48%. That means that out of all AUD/USD positions recorded by the Chicago Futures Trading Commission (CFTC), 48% were net-short AUD.
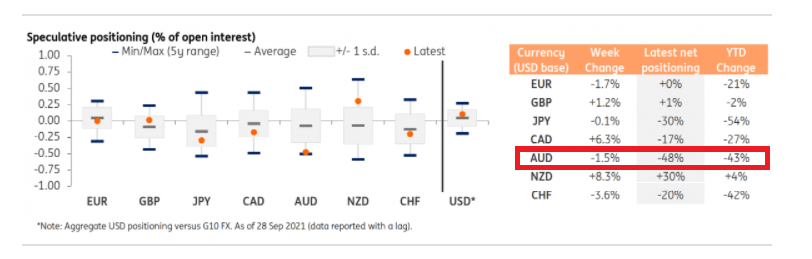
Source: ING, CFTC
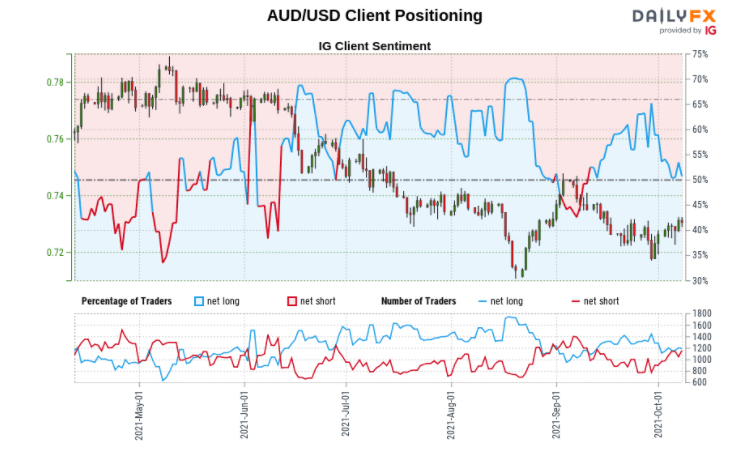
AUD/USD client sentiment observed through IG tells more of a mixed story as retail traders are ever so slightly long at 51%. The combination of current sentiment and recent changes according the contrarian indicator provides a mixed AUD/USD trading bias.
| Change in | Longs | Shorts | OI |
| Daily | 2% | 3% | 2% |
| Weekly | 29% | -46% | 0% |
Major Risk Events in the Week Ahead
Next week sees US Michigan consumer sentiment, core inflation data and retail sales data for September, along with the FOMC minutes from the September meeting. On the Australian front we have the October reading of consumer confidence and employment data for September.
Economic Calendar for the Week Ahead

For all market-moving data releases and events see the DailyFX Economic Calendar
--- Written by Richard Snow for DailyFX.com
Contact and follow Richard on Twitter: @RichardSnowFX


