


Oil Forecast: Neutral
- Crude oil prices return to trendline resistance after US jobs report (NFP’s) misses expectations.
- US Crude (WTI) continues to test the key psychological level of $70 p/b, Brent Crude eyes $74
- US Dollar weakness has supported the oil rebound, can oil maintain its bullish narrative?

Oil – US Crude (WTI) Price Action
After rebounding off of the August low, oil supply shortages supported the strong rebound in oil prices, allowing bulls to temporarily drive prices higher. However, buyers are currently facing a wall of resistance at the key psychological level of $70/b. Although price action remains above prior trendline resistance, turned support, fundamental factors may further assist in the catalyzation of price action for the short-term move.
How to Trade Oil: Crude Oil Trading Strategies & Tips
Meanwhile, the weekly chart below illustrates how Fibonacci levels from historical moves have provided additional support and resistance for oil prices over a longer period of time. Since breaking above trendline resistance, price action has been bouncing between $64.08 (support) and $75.19 (resistance), two key levels of the 2013 – 2020 move.
Introduction to Technical Analysis
Fibonacci
Learn more about Fibonacci with DailyFX Education
US Crude Oil (WTI) Weekly Chart
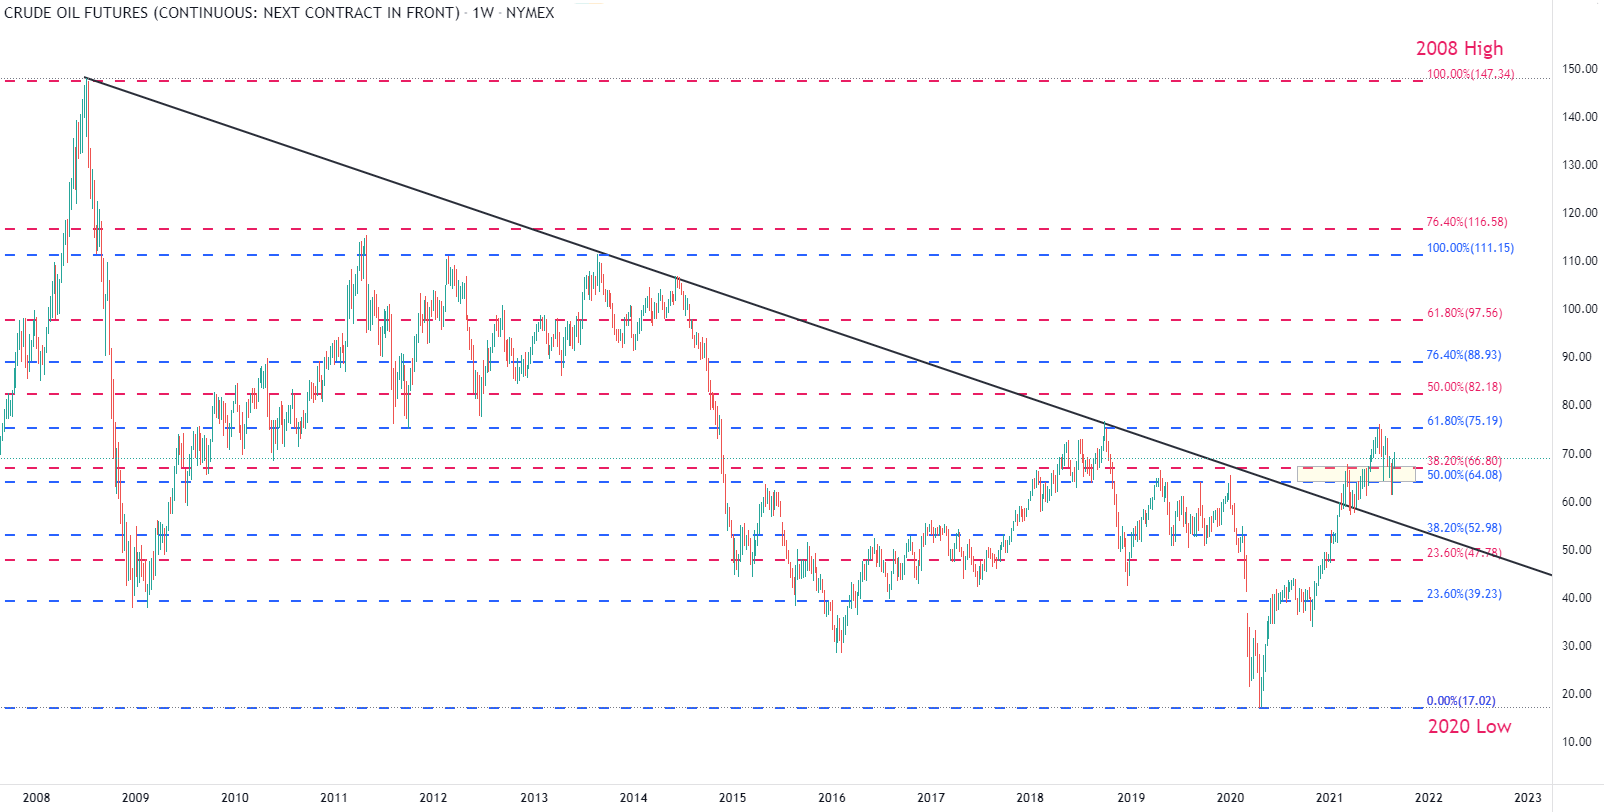
Chart prepared by Tammy Da Costa using TradingView
Oil prices – breakout or reversal?
While the above-mentioned levels will likely continue to provide support and resistance for the longer-term move, the daily chart provides a clearer perspective for the imminent move. After pricing in the lower-than expected US non-farm payroll report (NFP), oil prices retreated back below trendline resistance, below $70,00.

If bulls are able to push through this level, a breakout towards $75,19 may be in the cards. However, fears of higher wage inflation and increased selling pressure could result in a resumption of the bear trend and a possible retest of $66,80, the 38.2% Fibonacci retracement level of the historic move (2008 high – 2020 low).
US Crude Oil (WTI) Daily Chart

Chart prepared by Tammy Da Costa using TradingView
| Change in | Longs | Shorts | OI |
| Daily | 3% | -7% | 1% |
| Weekly | 31% | -38% | 7% |
--- Written by Tammy Da Costa, Analyst for DailyFX.com
Contact and follow Tammy on Twitter: @Tams707


