


WEEKLY CRUDE OIL PRICE OUTLOOK – NEUTRAL
- Crude oil prices dropped -2% in July on balance despite back-to-back weekly gains
- The commodity has climbed 13.5% since finding support at the $66.25-price level
- Year-to-date highs and resurfacing covid fears pose headwinds for oil price action
Crude oil price action advanced 2.4% this past week, extending its rebound to 13.5% off the 20 July swing low. Nevertheless, the commodity closed -2% lower for the month and still trades -4% below its year-to-date high near $77.00/bbl. Turbulence across crude oil prices largely follows sputtering bullish drivers as supply-demand imbalances are slowly rectified.

While outlook for crude oil and other major commodities remains generally upbeat, there is potential for WTI oil prices to continue facing headwinds and even snap back lower. This is in light of mounting concern around covid and the delta variant, which surely presents noteworthy downside risk. The Biden administration just stated, for example, that they are open to returning to lockdowns if advised by the CDC.
CRUDE OIL PRICE CHART: DAILY TIME FRAME (10 FEBRUARY TO 30 JULY 2021)
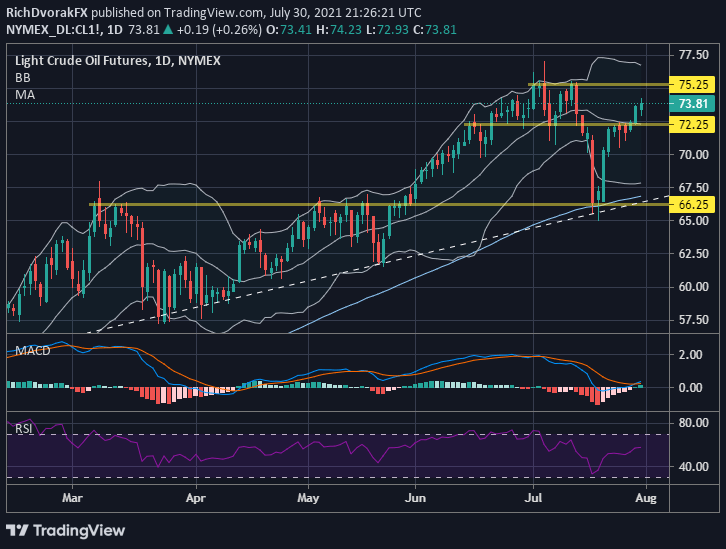
Chart by @RichDvorakFX created using TradingView
Not to mention, serious technical resistance lurks above and threatens to keep a lid on crude oil price action. Technical resistance facing crude oil is roughly highlighted by the $75.25-price level and the 13 July close. This is a zone of confluence that extends all the way back to where oil peaked in 2018. The $77.00-handle and year-to-date swing high likewise underpin the technical obstacles with potential to thwart oil price gains. Similarly, the upper Bollinger Band might help contain the commodity.

Pullbacks could see the 20-day simple moving average and $72.25-price level come back into focus for crude oil bears. Breaching this support level likely opens up the door to another look at July lows around $66.25/bbl. This scenario might materialize if there is another influx of risk aversion amid deteriorating market sentiment. That said, crude oil traders might want to have the VIX Index and OVX Index near the top of the list of bellwethers for where the commodity heads next given their historically strong inverse relationship with oil price action.
-- Written by Rich Dvorak, Analyst for DailyFX.com
Connect with @RichDvorakFX on Twitter for real-time market insight


