


Nasdaq 100, Russell 2000 Forecasts: Bullish
- The Nasdaq 100 trades near the upper bound of an ascending channel that dates back 11 months
- The Russell 2000 suffered a key technical break in early July but remains above important technical levels

Nasdaq 100 Technical Forecast
Outlook: Bullish
The Nasdaq 100 endured hectic price action last week as earnings from major technology companies and a FOMC rate decision worked to drive volatility across markets. With much of the scheduled event risk behind it, the Nasdaq 100 can take stock of its position and look to continue the upward trajectory it has enjoyed since the pandemic lows. With that in mind, resistance to the topside is limited.
Nasdaq 100 Price Chart: Daily Time Frame (September 2020 – August 2021)
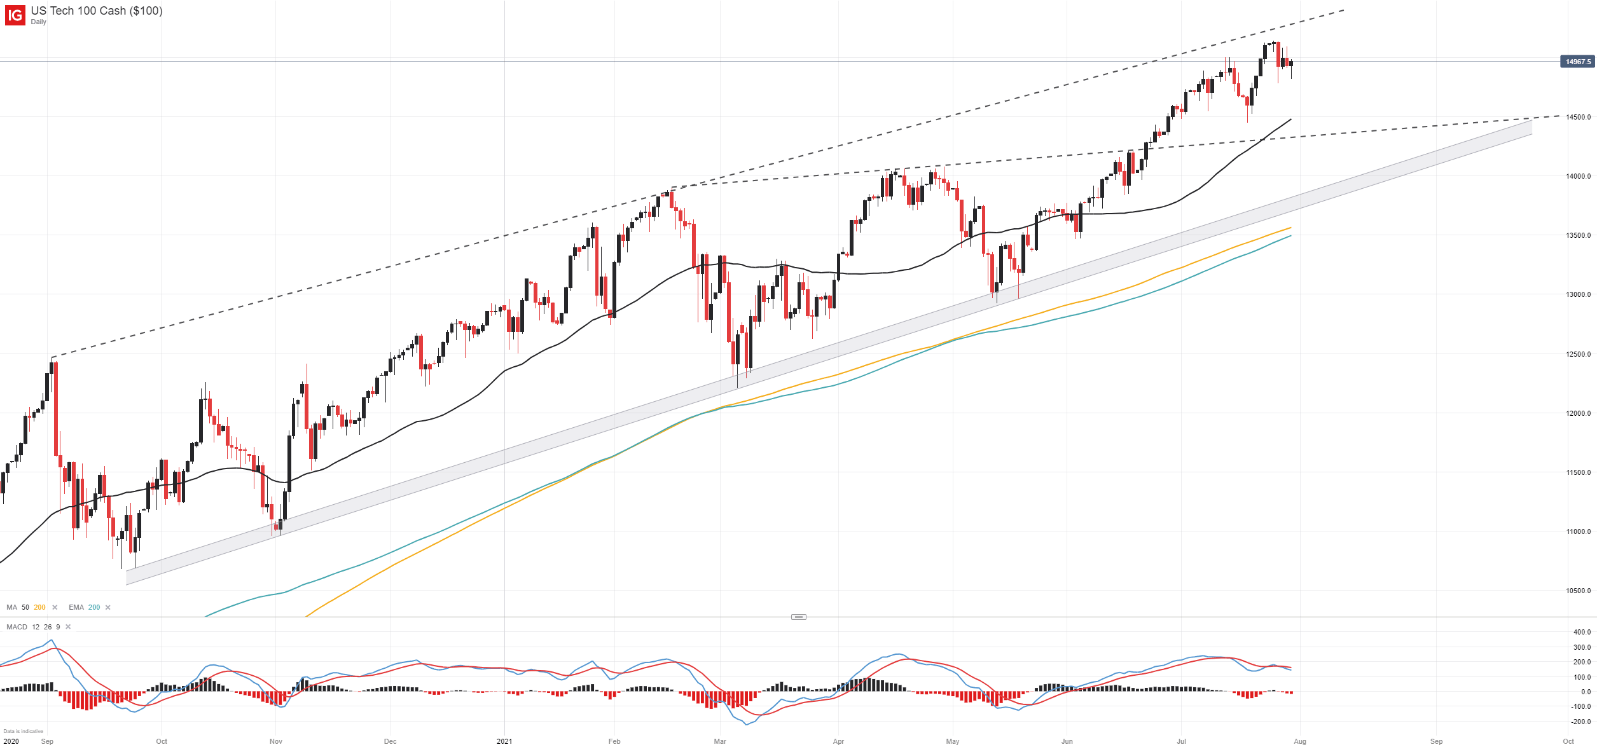
Trading just shy of record levels, the Nasdaq 100 has few technical levels to work with overhead which may allow gains to continue with relative ease. One barrier to consider is a rising trendline projection drawn off the September 2020 and February 2021 peaks. On the other hand, the tech-heavy index has a plethora of support to work with should risk appetite sour.
The Trend is Your Friend: Forex Trendlines
First and foremost may be the index’s 50-day moving average around 14,500. While intermediary levels exist, the effective “line in the sand” at this stage can be found along the series of swing lows dating back to September 2020. The resultant barrier marks the lower side of the rising channel and broader uptrend.
Russell 2000 Technical Forecast
Outlook: Bullish
While the Nasdaq 100 pushes to new heights, the Russell 2000 trades just above its 200-day simple moving average and has made little progress to the topside since early February 2021. That said, the outlook for the small cap index is encouraging nonetheless. Recent weakness may have allowed for healthy consolidation and the index, with fundamental tailwinds behind it, could look to retest its all-time high at 2,367.
Russell 2000 Price Chart: Daily Time Frame (February 2020 – August 2021)
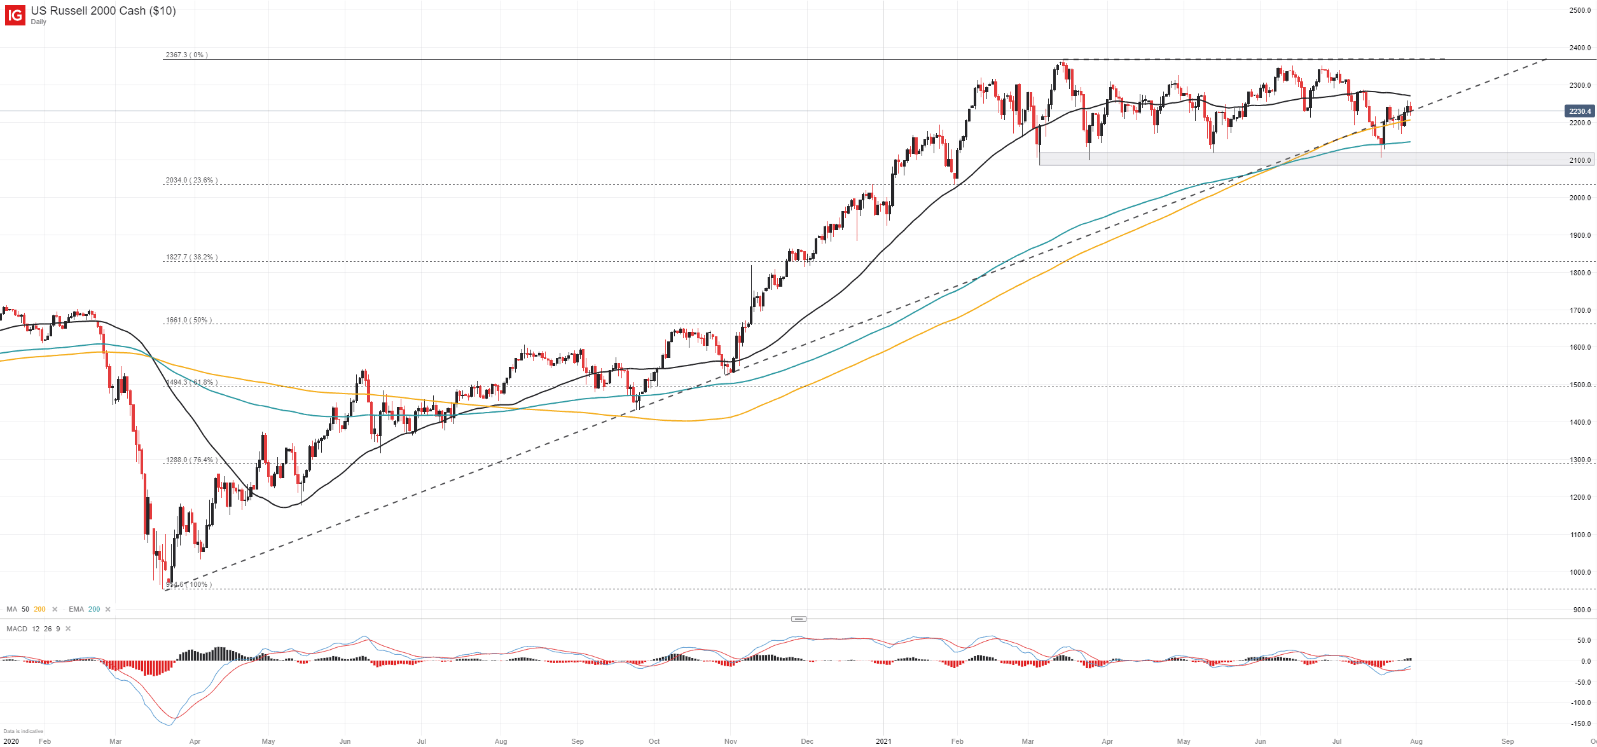
Such an attempt would require the index to break the 50-day moving average and maintain its trajectory above the rising trendline from March 2020. While the recent breakdown did constitute a material downgrade in the technical landscape, there is little to suggest a broader downtrend is likely at this stage and, short of a break beneath 2,100, the index may remain in a position of strength going forward. In the meantime, follow @PeterHanksFX on Twitter for updates and analysis.

--Written by Peter Hanks, Strategist for DailyFX.com


