


Australian Dollar, AUD/USD, AUD/JPY, AUD/NZD, AUD/CAD – Weekly Technical Outlook
- Australian Dollar continues to aim lower against most of its peers
- AUD/USD eyeing another Death Cross, AUD/JPY could recover
- AUD/NZD downtrend and AUD/CAD falling channel still in play

AUD/USD - Bearish
The Australian Dollar continued its downward trajectory against the US Dollar this past week. Albeit, AUD/USD trimmed losses into the weekend. Now, a bearish crossover between the 50-day and 200-day Simple Moving Averages may open the door to a broader bearish outlook. We have not seen an identical ‘Death Cross’ between the same SMAs on the daily chart since April 2018. Resuming the downtrend entails clearing 0.7290 towards lows from September. Positive RSI divergence is still present, showing that downside momentum is fading. That may precede a bounce towards the near-term SMAs.

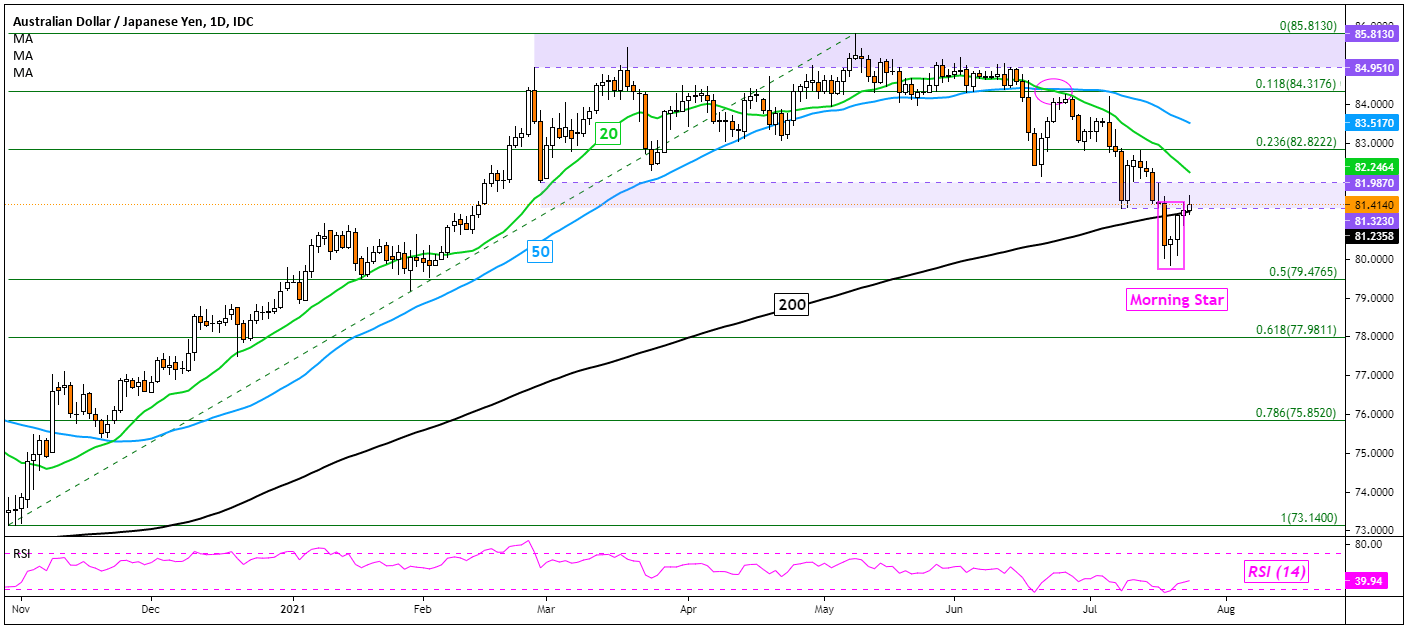
AUD/JPY - Neutral
The Australian Dollar also weakened against the Japanese Yen, then trimming most losses as Friday wrapped up. On the daily chart, AUD/JPY left behind and subsequently confirmed a bullish Morning Star candlestick pattern. This is as prices were unable to hold a break under the 200-day SMA, which is maintaining the dominant upside focus. As such, the increased probability of a turn higher leaves the outlook neutral. Keep a close eye on the former 81.323 – 81.987 support zone, it may act as new resistance.
AUD/NZD – Bearish
The Australian Dollar maintained declines against the New Zealand Dollar this past week. But, AUD/NZD was unable to breach the key 1.0541 – 1.0564 support zone, composed of lows from February. Still, a bearish crossover between the 20- and 50-day SMAs is offering a near-term downward technical bias. Clearing immediate support exposes the December low at 1.0418. Otherwise, a bounce off support could open the door to retesting the SMAs. Those may reinstate the downward trajectory.


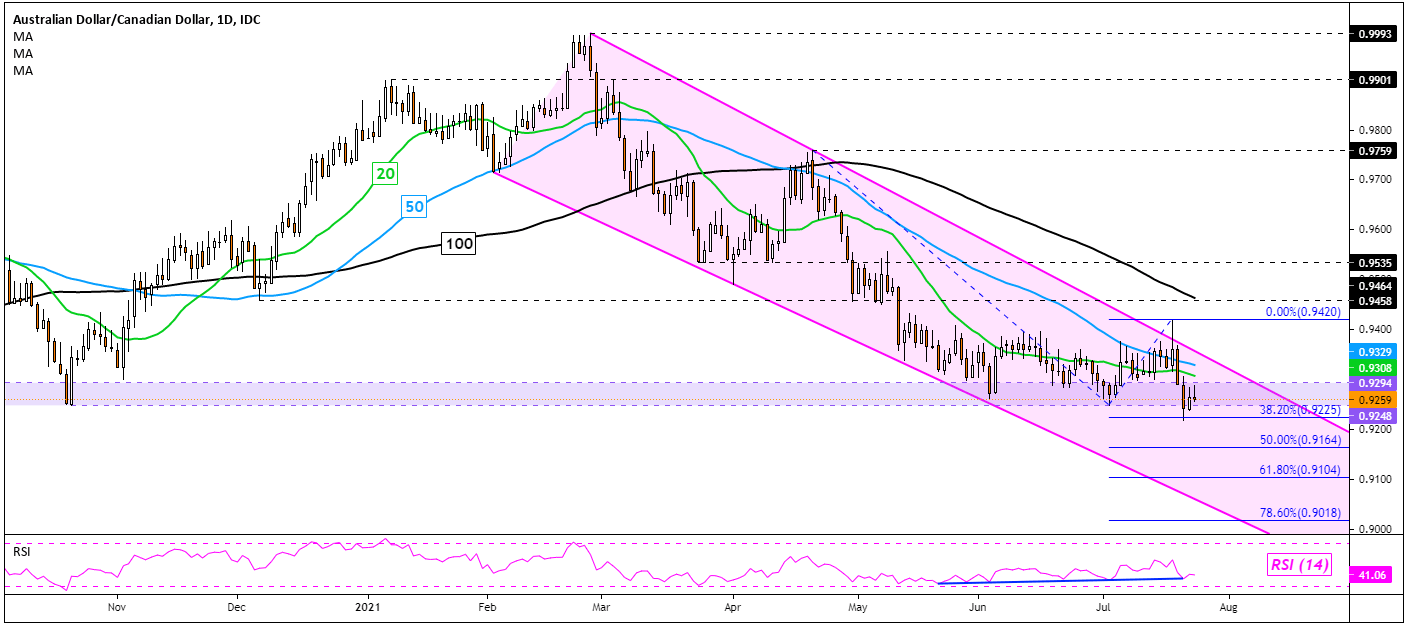
AUD/CAD – Bearish
The Australian Dollar aimed lower and maintained losses against the Canadian Dollar this past week. Still, AUD/CAD continues to struggle making progress through the 0.9248 – 0.9294 support zone that was established back in June 2020. Positive RSI divergence does warn that downside momentum is fading. However, the 20-, 50- and 200-day SMAs continue to offer a dominant downside bias as prices consolidate lower within a Descending Channel. The pair was unable to breach the ceiling of the channel this past week. Resuming losses will have the Fibonacci extensions in focus on the chart below.
--- Written by Daniel Dubrovsky, Strategist for DailyFX.com
To contact Daniel, use the comments section below or @ddubrovskyFX on Twitter


