US Dollar Technical Forecast Talking Points:
- The DXY Dollar Index has worked its way into the smallest two-week trading range since February 2020
- A technical break seems inevitable, but momentum after the clearance is more dependent on market conditions than direction or the spark
- A path of least resistance break for the Dollar would benefit a range like EURUSD’s while the assumptions of a bullish Dollar charge in a GBPUSD reversal


Technical Forecast for US Dollar: Bearish
The US Dollar is primed for a technical break. Such a scenario naturally draws a lot of excitement, but identifying such scenarios is the least important factor of an effort to trade around such a scenario. Direction of course is also critical, but criteria for determining a break can help account for that factor. Far more difficult in the equation is the potential for follow through. Market conditions that dictate the general tempo of the broader financial system go much further along these lines, but they can be difficult to evaluate for many as they are not usually inherent to a singular asset. With seasonality expectations matching low volume and open interest more broadly across the markets, we are swimming in conditions in which it is likely difficult to establish a trend. That weighs on my evaluation of what comes next. For staging, the DXY Dollar Index is showing the hallmarks of an impending break. The range the benchmark has carved over the 10 trading days through Friday’s close is the smallest as a percentage of spot since February 2020.
Chart of DXY Dollar Index with 20 and 100-Day Moving Averages (Daily)
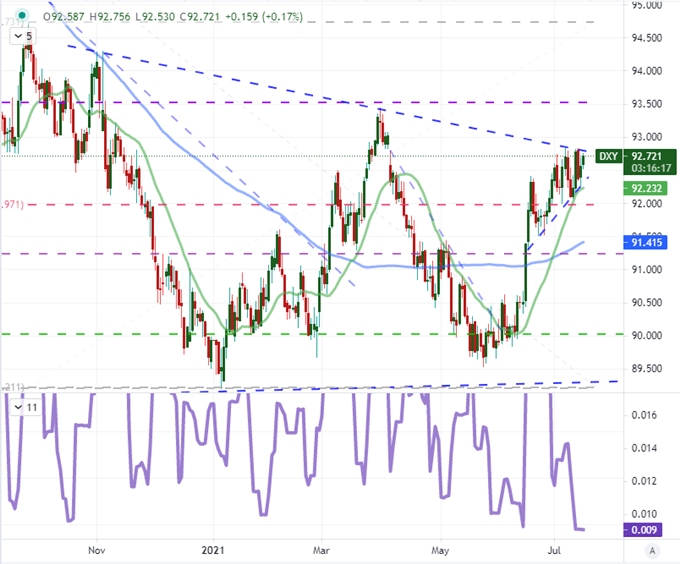
Chart from TradingView
Considering the levels, The upside is defined by a descending trendline of peaks starting with the November 2020 high and follows down to a present course of 92.80 which happens to also be congestion high of the past two weeks. This isn’t the most robust barrier, but it carries with it the implications of a bigger bullish effort that could register as a serious effort at very overt trend reversals for the likes of EURUSD, GBPUSD and AUDUSD. Remember, the DXY is a trade-weighted index and most trades are placed on the crosses with somewhat different technical structures. To the immediate downside, trendline support goes back to June 17th and is backed by the 20-day moving average in a zone of 92.20-92.30. A break in this direction would be the path of least resistance. That doesn’t necessarily make it more probable, but follow through could be easier to foster in a bearish move should it take.
Chart of DXY Dollar Index with 120-Period Moving Average (4-Hour)
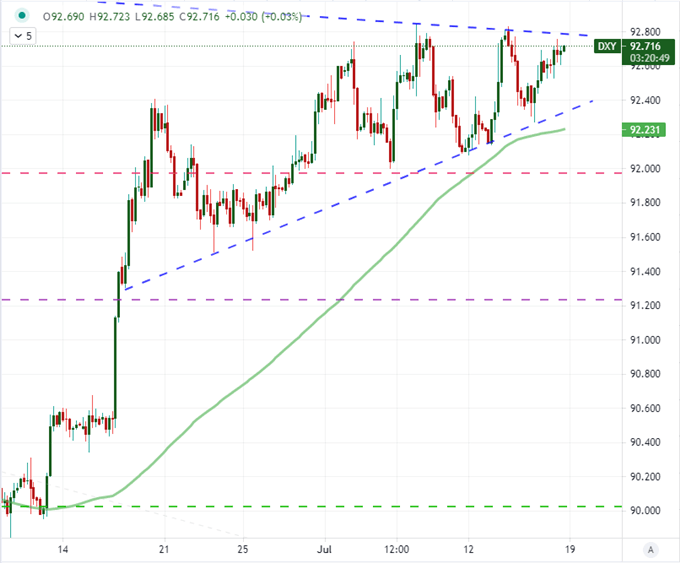
Chart from TradingView
Taking a minute to look at the bigger picture to mark the bigger milestones, the curb on bearing is more readily appreciated with a monthly chart. On this scale, the bullish break would be the path of least resistance, but that would be again 90/89 which is support built out over the past six years and the 38.2 percent Fib of the past 35 years’ range.
Chart of DXY Dollar Index (Monthly)
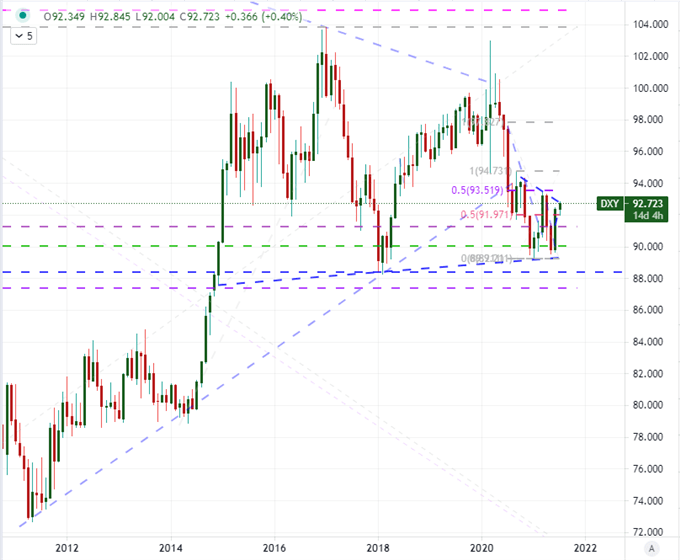
Chart from TradingView
Highlighting a specific Dollar cross is difficult. There are some very provocative charts amongst the majors. EURUSD looks more appealing to me given its mirrored picture of DXY and should it hold its larger range with a break above 1.1850 on the path of least resistance notion. For a pair that is better staged for the Dollar defying the odds and attempting to mount momentum on a bullish trend, GBPUSD breaking 1.3750 as an ascending triangle or head-and-shoulders neckline support is appealing as is AUDUSD attempting to put momentum behind its already established H&S break from last month. There is a lot of fundamental baggage on those pairs however. If I’m looking for a pair that could move back into range and still have the loaded picture of the DXY itself, it would be USDJPY. The pullback off of 111.50 turned into the 2021 trendline support break and now a head-and-shoulders pattern in the aftermath is a pressurized picture. It still needs to muster the conviction on a break of 109.50 however.
Chart of USDJPY with 100-Day Moving Average, Spot-MA Disparity and COT Positioning (Daily)
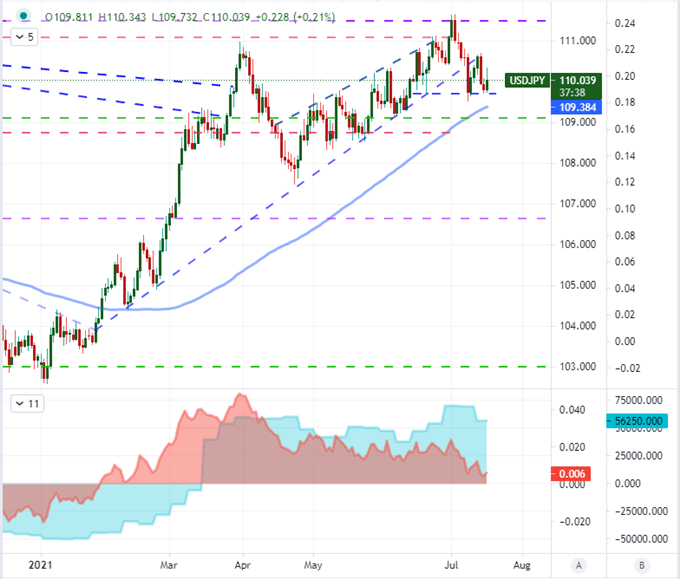
Chart from TradingView
Taking speculative positioning into consideration, it seems interest through the various futures contracts backed by the Dollar are expecting a bullish break may be ahead over the coming weeks. Through the end of this past week, the speculative rank flipped to a net long position behind the Greenback for the first time in just over a year. That should not be taken as serious conviction however. There have been some notable misses on general course at critical technical points for this crowd over the past years. No one has a crystal ball – whether individual or group.
Chart of DXY Dollar Index Overlaid with Net Speculative USD Futures Positioning (Weekly)
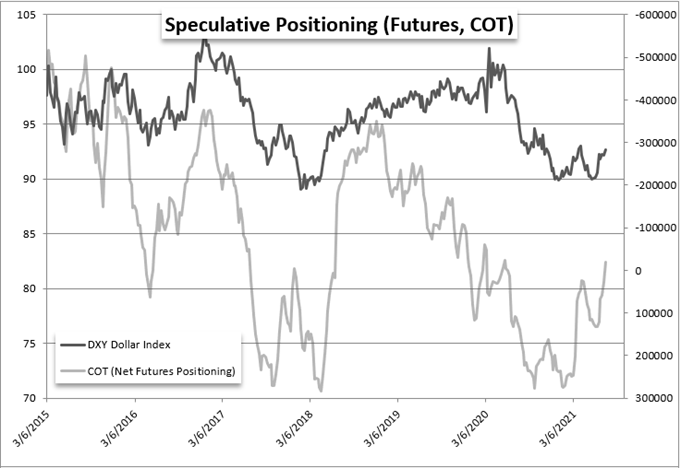
Chart Created by John Kicklighter with Data from CFTC’s COT


.


