


GOLD PRICE WEEKLY TECHNICAL FORECAST – NEUTRAL
- Gold price action finished the week practically flat after falling -1% on Friday
- XAU/USD has advanced for four-weeks straight to challenge key resistance
- Bookmark our Real Time News page for breaking market news and analysis

Gold price action whipsawed this week as the precious metal pulled back -1% on Friday after popping 1% higher on Wednesday. XAU/USD has been gaining ground largely in response to plunging real yields, though the technical landscape is likely weighing on gold too. The rally set in motion by gold bulls over the last four weeks seems to be fizzling now out as confluent resistance around the $1,835-price level comes into play.
XAU/USD – GOLD PRICE CHART: DAILY TIME FRAME (26 MARCH TO 16 JULY 2021)

Chart by @RichDvorakFX created using TradingView
This technical barrier is reinforced by the upper Bollinger Band as well as the 50-day and 200-day moving averages. The market reacting to this area of technical resistance is likely encouraging for gold bears, though the precious metal does still tread water above the psychologically-significant $1,800-level. XAU/USD price action could snap lower for another look at June lows if the $1,800-level is breached. On the other hand, invalidating nearside resistance likely opens up the door to the $1,900-handle.
| Change in | Longs | Shorts | OI |
| Daily | 1% | -3% | -1% |
| Weekly | 2% | -8% | -2% |
XAU/USD – GOLD PRICE CHART: WEEKLY TIME FRAME (NOVEMBER 2020 TO JULY 2021)
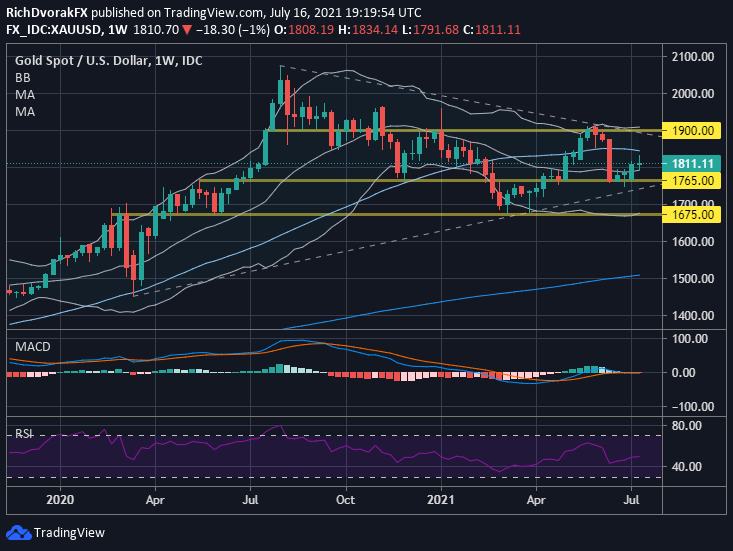
Chart by @RichDvorakFX created using TradingView
All in all, I think that Friday’s -1% drop could just be a healthy and modest unwind of recent gains. As such, it will be important to keep an eye out for follow-through early in the week ahead to determine if there is greater risk of more downside or if upward momentum can resume. That said, technical support looks quite formidable, and as discussed in my Q3 top trade idea, gold and silver price pullbacks could provide attractive opportunities to consider long exposure. This thesis is also technically buttressed by the broader bullish trendline that extends through the March 2020 and March 2021 swing lows. Nevertheless, a notable deterioration in market sentiment could bring year-to-date lows back into focus.

-- Written by Rich Dvorak, Analyst for DailyFX.com
Connect with @RichDvorakFX on Twitter for real-time market insight


