


Australian Dollar, AUD/USD, AUD/JPY, AUD/CAD, GBP/AUD – Weekly Technical Outlook
- Australian Dollar extended losses against its major peers this past week
- AUD/USD may decline after 200-day SMA break, AUD/JPY eyes support
- AUD/CAD may consolidate with downside bias, GBP/AUD breakout eyed

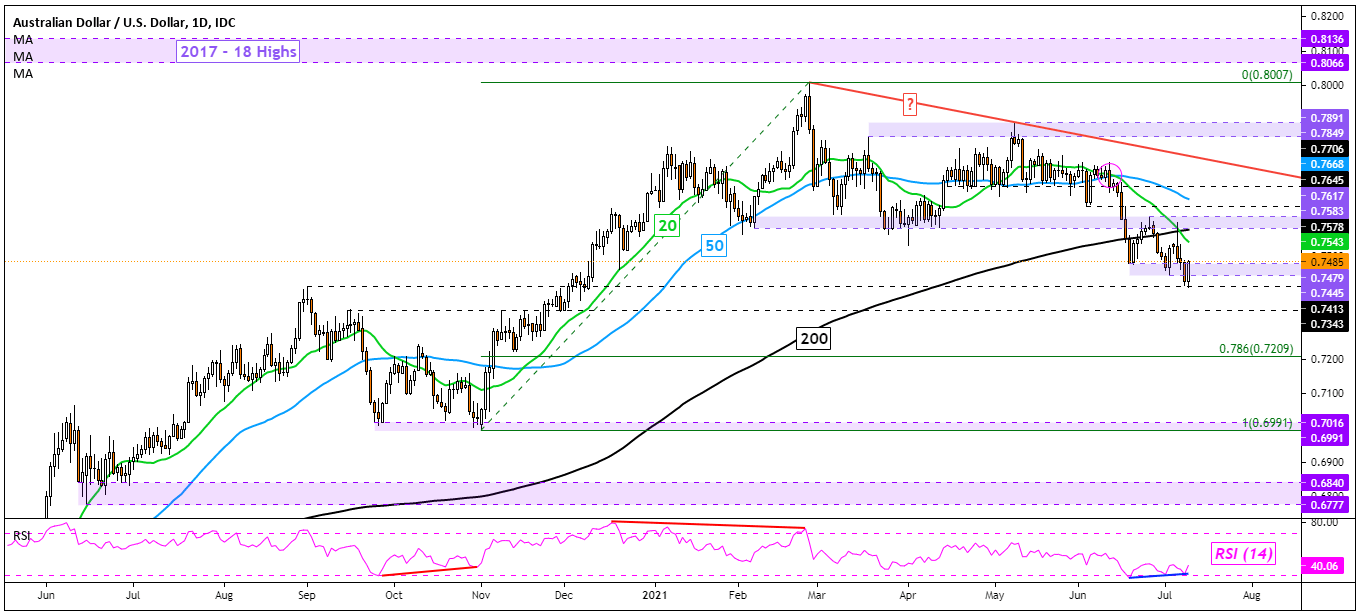
AUD/USD - Bearish
The Australian Dollar extended its decline this past week against the US Dollar, with AUD/USD further confirming the break under the 200-day Simple Moving Average (SMA). A bearish crossover between the near-term 20-day and 50-day SMAs are also offering a downside bias. Still, immediate support remains the 0.7445 – 0.7479 range. Positive RSI divergence does show that downside momentum is fading. That can at times precede a turn higher. If not, the pair may aim towards lows from September.
AUD/JPY - Neutral
The Australian Dollar also aimed lower against the Japanese Yen this past week, although AUD/JPY trimmed some losses on Friday. This meant that the key 81.762 – 82.427 support zone remained in play and will likely be key to watch in the coming week. While a bearish crossover between the 20- and 50-day SMAs remains in play, the 200-day equivalent could still maintain the dominant focus to the upside. Positive RSI divergence is also persisting here which could precede a turn higher towards the near-term SMAs. Extending losses may place the focus on the midpoint of the Fibonacci retracement at 79.4765.

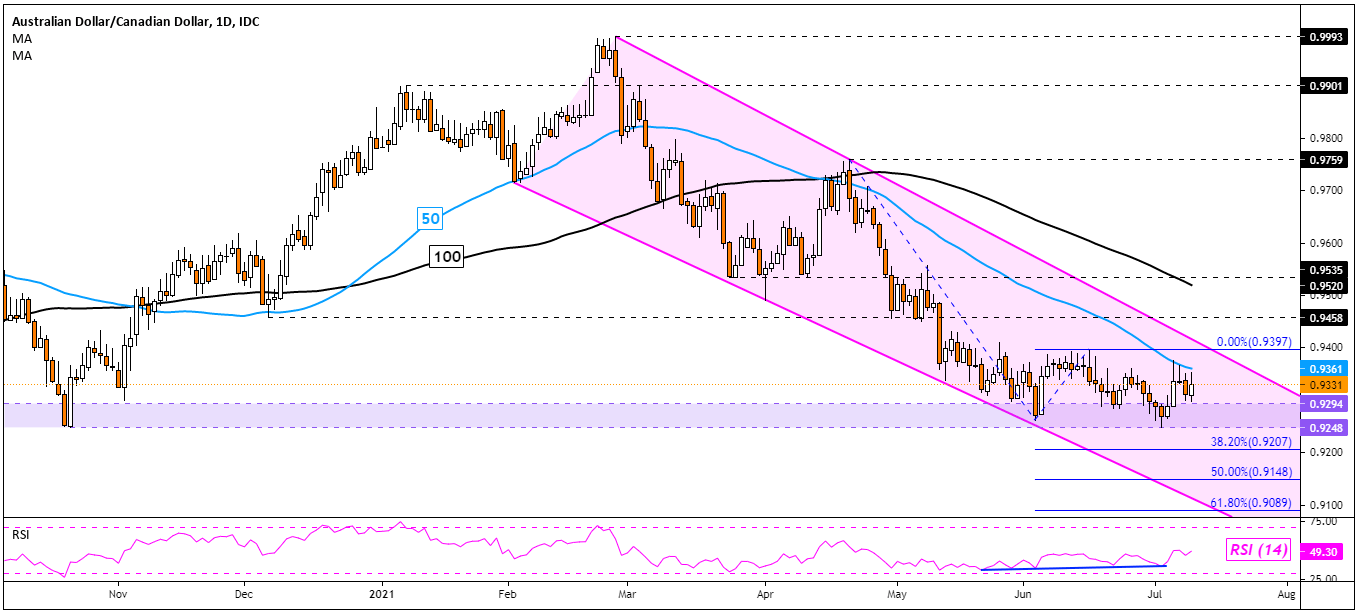
AUD/CAD – Neutral
AUD/CAD continues to trade in a consolidative state, with the Australian Dollar idling above the key 0.9248 – 0.9294 support zone. Still, the 50-day and 100-day SMAs continue to offer a downside bias. Moreover, the pair appears to be trading within a Descending Channel since February, which could continue offering a downward direction. Positive RSI divergence may persist, warning that a turn higher could be in store. Otherwise, clearing key support exposes the 38.2% Fibonacci extension at 0.9207.

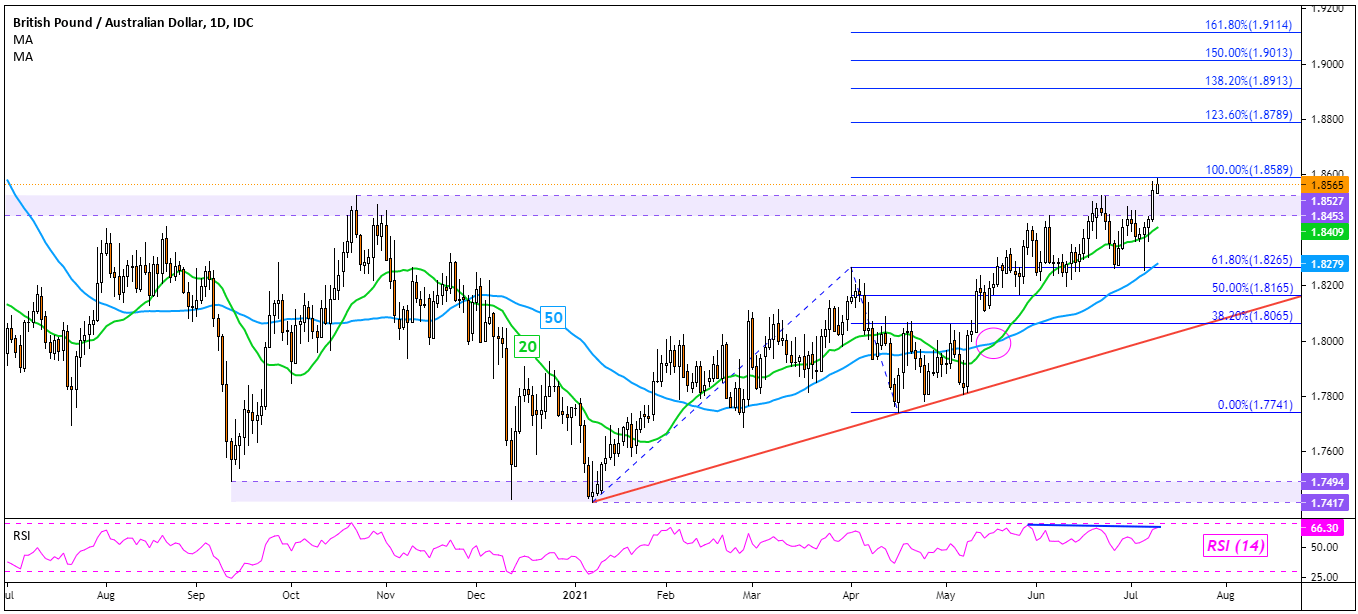
GBP/AUD – Bullish
The British Pound may extend gains against the Australian Dollar after GBP/AUD was able to push above the 1.8453 – 1.8527 resistance zone. Still, negative RSI divergence continues to persist. That may be a warning a turn lower could be in the cards. But, the near-term 20- and 50-day SMAs are offering an upside bias. Those may come into play as key support in the event of a turn lower, potentially reinstating the focus to the upside. Clearing immediate resistance would then expose the 123.6% Fibonacci extension at 1.8789.

--- Written by Daniel Dubrovsky, Strategist for DailyFX.com
To contact Daniel, use the comments section below or @ddubrovskyFX on Twitter


