CRUDE OIL WEEKLY TECHNICAL FORECAST – NEUTRAL
- Crude oil has started peeling back from technical resistance near the 66.25-price level
- WTI crude oil prices may extend a bit lower with the commodity starting to consolidate
- Oil looks likely to maintain its broader bullish trend so long as sentiment stays upbeat
- Learn about WTI vs Brent or visit our education center for insight on technical analysis
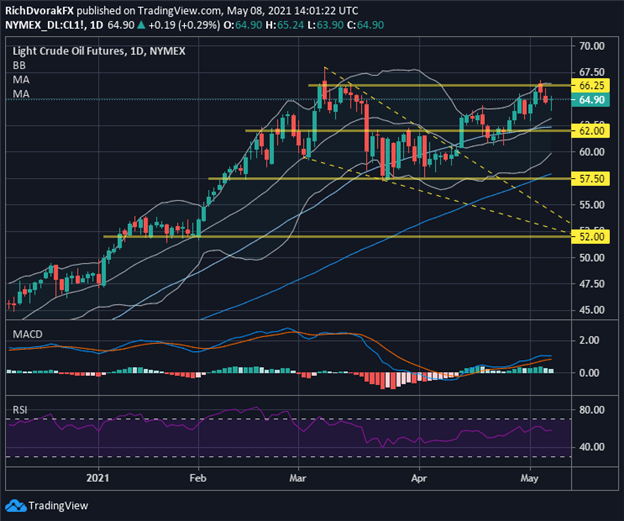
Crude oil price action finished the week modestly higher. The commodity gained 2% on balance to close around 65.00/bbl. WTI oil prices were up as much as 5% by Wednesday’s trading session, but failure to overcome technical resistance near 66.25 corresponded with a slight pullback from year-to-date highs. Crude oil bulls have likely struggled to maintain buying pressures amid falling import demand from Japan and India. This has increased the odds for crude oil to consolidate lower and underperform other major commodities.


CRUDE OIL PRICE CHART: DAILY TIME FRAME (08 DECEMBER 2020 TO 07 MAY 2021)

Chart by @RichDvorakFX created using TradingView
Crude oil pullback potential is also highlighted by the Bollinger Band and MACD indicator on the chart above. The MACD histogram speaks to waning upward momentum as the Bollinger Band width compresses following a pushback by crude oil bears at resistance posed by the 66.25-price level. This brings to focus possible layers of technical support that may help stymie recent selling pressures.
WTI crude oil bulls could look to defend confluent support around the 62.00-handle if a deeper pullback does come into play. This area of buoyancy is roughly underpinned by the 20-day and 50-day simple moving averages. Failure to hold this area of support might encourage a bigger push by bears that sends crude oil price action snapping lower toward its bottom Bollinger Band. A sharper selloff might even bring the 57.50-price level into focus, which is buttressed by the March swing lows and 100-day simple moving average.
| Change in | Longs | Shorts | OI |
| Daily | 3% | -7% | 1% |
| Weekly | 31% | -38% | 7% |
That said, generally upbeat market sentiment and prevailing appetite for risk likely stand to keep crude oil prices trending broadly higher. If WTI crude oil can overcome recent headwinds and invalidate resistance at the 66.25-price level, this could tee up a breakout higher toward 74.00/bbl where 2018 highs reside. Crude oil traders might want to consider tracking IG Client Sentiment as well seeing that this indicator can provide an added bellwether to where the commodity heads next.
Learn More – How to Trade Oil: Crude Oil Trading Strategies & Tips
-- Written by Rich Dvorak, Analyst for DailyFX.com
Connect with @RichDvorakFX on Twitter for real-time market insight


