


CRUDE OIL FORECAST: WTI PRICES STRUGGLING AS COVID-19 RAGES ACROSS INDIA
- WTI crude oil appears to be facing some pushback near $66.25 and year-to-date highs
- Crude oil prices may struggle to sustain upward momentum as India grapples with covid
- The commodity could stay supported more broadly amid economic reopening elsewhere
- Refine your technical analysis, learn about WTI vs Brent, or review this oil trading guide
Crude oil price action pushed higher early on during Wednesday trade, but the commodity has since turned lower as the session progressed. A larger-than-expected decline in crude oil inventories reported this morning may have helped fueled the bid. With the dire state of affairs in India due to covid-19, however, WTI prices seem to be facing headwinds. Even though the world’s third largest oil importer has fought off calls for a government-mandated lockdown to help reign in the worsening pandemic, economic activity is more than likely to slow as consumer confidence – and consumption – degrades.
Learn More – Global Commodities: Worldwide Imports & Exports Over the Last Decade
CRUDE OIL PRICE CHART: DAILY TIME FRAME (16 OCT 2020 TO 05 MAY 2021)
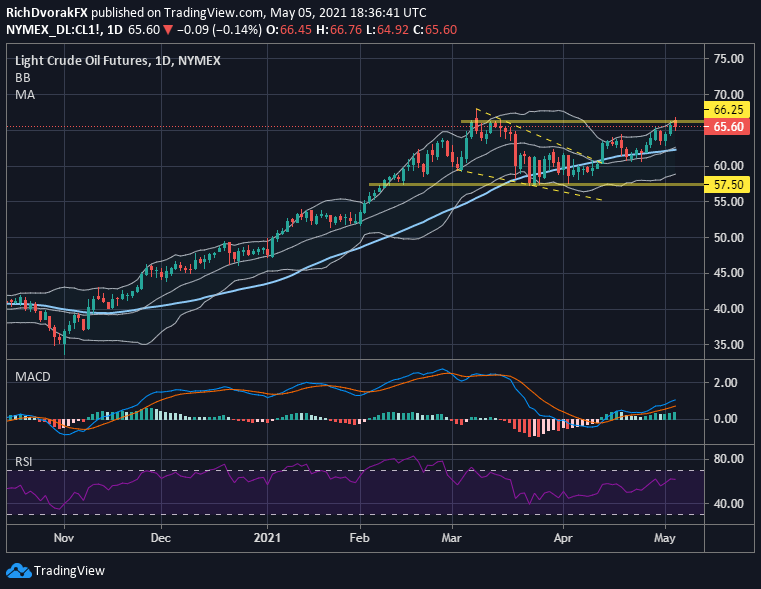
Chart by @RichDvorakFX created using TradingView
Since our last crude oil price forecast, where we highlighted a bullish breakout from the falling wedge pattern, the commodity has gained ground to test the technical resistance level we outlined around $66.25/bbl. This huge layer of resistance goes all the way back to the April 2019 swing highs.
| Change in | Longs | Shorts | OI |
| Daily | 4% | -11% | 1% |
| Weekly | 37% | -33% | 14% |
If crude oil prices can top this technical barrier, however, the commodity might extend its rally toward 2018 highs around $74.00/bbl. On the other hand, crude oil bears could make a push here off the upper Bollinger Band and send WTI prices lower toward the positively-sloped 50-day and 20-day moving averages. Invalidation of this potential support level could subsequently bring a test of the March swing lows around $57.50/bbl into focus.
Keep Reading – 8 Surprising Crude Oil Facts Every Trader Should Know
-- Written by Rich Dvorak, Analyst for DailyFX.com
Connect with @RichDvorakFX on Twitter for real-time market insight


