


Australian Dollar Technical Forecast: Slightly Bullish
- AUD/USD aims to recapture recently broken trendline after bullish week
- AUD/CAD upside may be limited with possible incoming bearish SMA cross
- AUD/JPY has fresh multi-year highs in view after Yen outflows boost pair higher

AUD/USD Technical Outlook
The Australian Dollar’s technical posture against the US Dollar improved last week, with AUD/USD rising over 1% after two consecutive weekly losses. The pair lost some upside momentum into the weekend as it approached a major trendline from the November swing low that previously served as support until prices pierced below the level earlier this month.
Along with its trendline – which now appears to be serving as an area of resistance – the 20-day Simple Moving Average and 50% pseudo- Fibonacci retracement level appear to be capping further upside. That said, the major obstacle for Aussie-Dollar bulls is to overtake these confluent levels of resistance before resuming the broader bull trend. To the downside, the 61.8% Fibonacci level may provide support.
AUD/USD Daily Chart

Chart Created with TradingView
| Change in | Longs | Shorts | OI |
| Daily | 2% | 3% | 2% |
| Weekly | 29% | -46% | 0% |
AUD/CAD Technical Forecast
The Australian Dollar has faltered against the Canadian Dollar, losing around 0.50% after losses accelerated toward the back half of the week on a blowout jobs report. The strength in crude oil is a likely contributing factor to the relative weakness in AUD/CAD, with the oil-linked Lonnie’s price bolstered from the rise in energy prices.
A point of support at the 23.6% Fibonacci retracement level gave way on Friday. Furthermore, a bearish crossover between the 20- and 50-day Simple Moving Averages appears to be in the offing over the next week. If that occurs, the bearish technical signal may pressure prices lower. On the other hand, bullish momentum may resume if prices manage to rise above the near-term 23.6% Fib level.
AUD/CAD Daily Chart
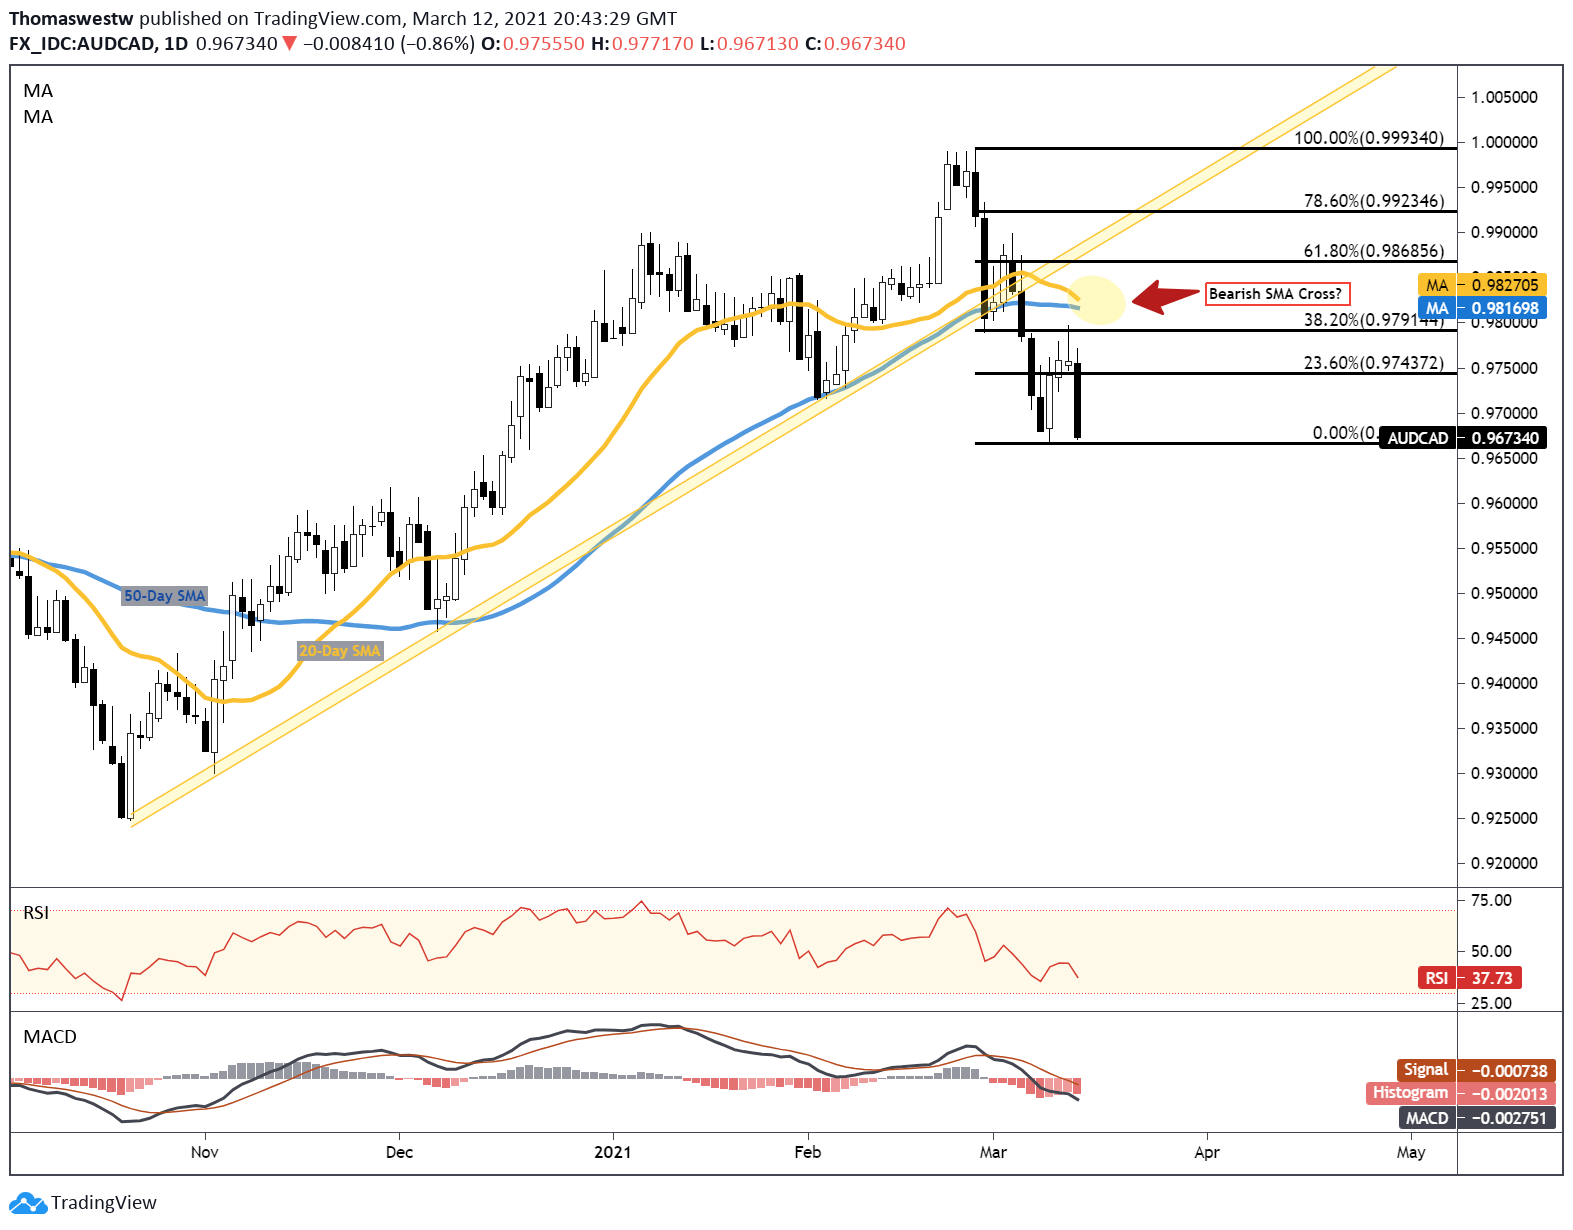
Chart created with TradingView
AUD/JPY Technical Forecast
Increased risk appetite in markets was the largest benefactor for the Australian Dollar versus the safe-haven Japanese Yen last week. AUD/JPY rose nearly 2% last week, as traders ditched the Yen for riskier assets. An intraday multi-year swing high from February is now in focus, and if risk appetite continues to improve or holds course, it may quickly attempt to extend higher.
After breaching above the 78.6% Fibonacci retracement level, prices are now focusing on the aforementioned high, which sits just below the psychologically imposing 85 handle. A trendline from November will offer resistance beyond that level. A move lower, however, would likely see the 78.6% Fib offer a level of support. Below that and the 12-day Exponential Moving Average will shift into view.
AUD/JPY Daily Chart
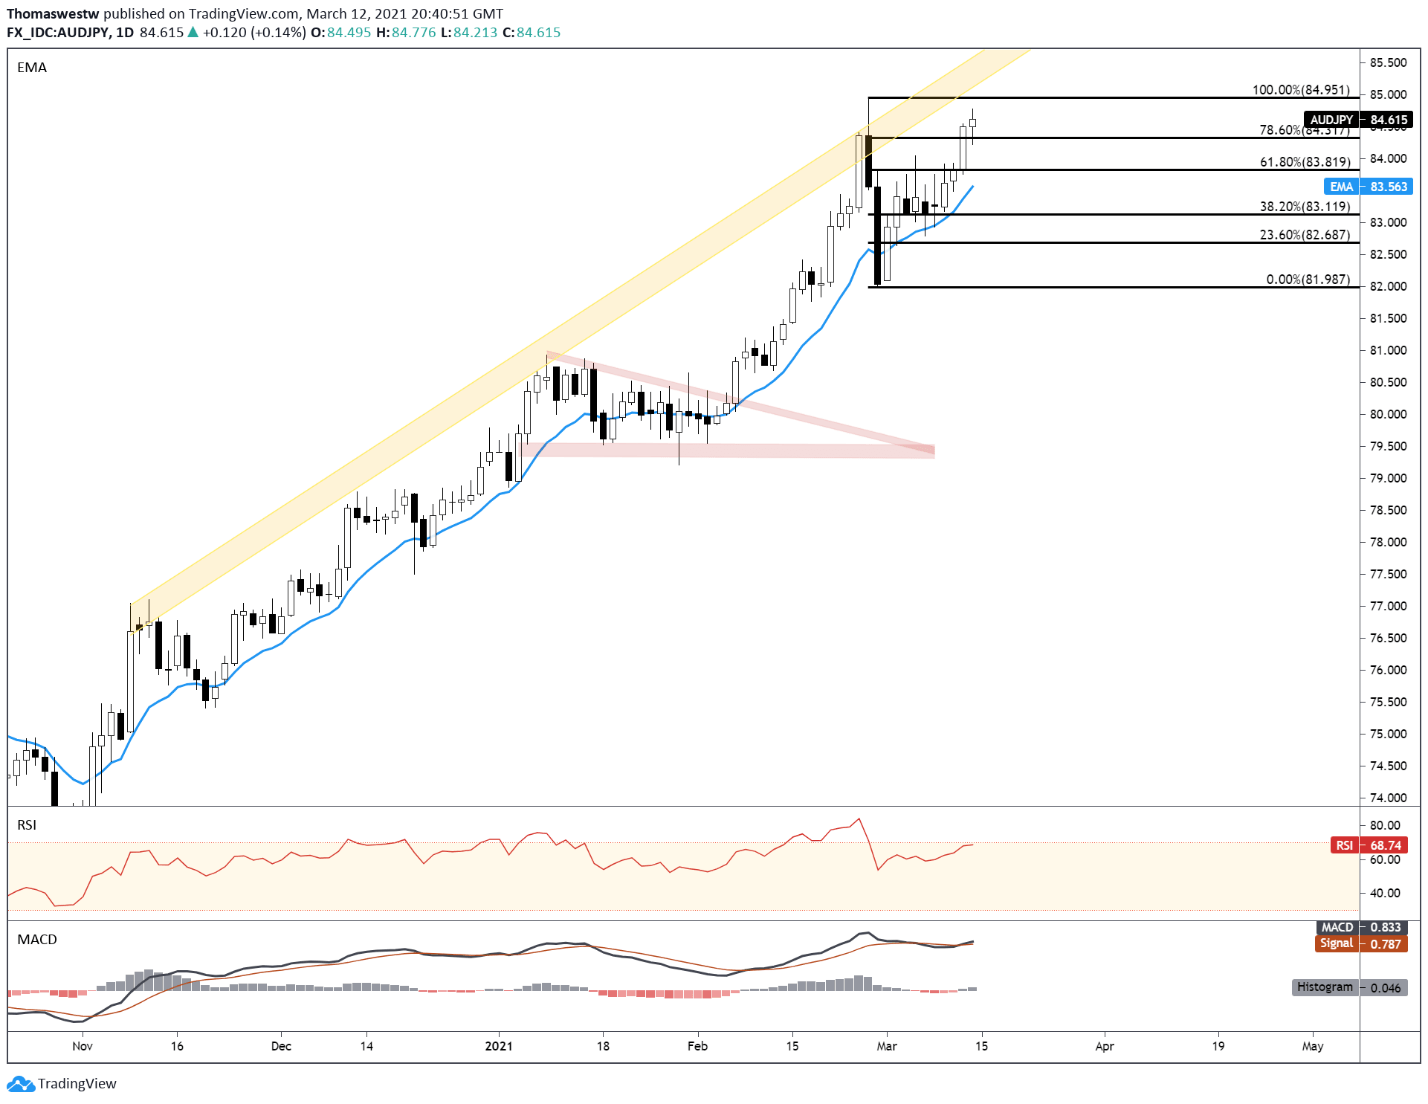
Chart created with TradingView
Australian Dollar TRADING RESOURCES
- Just getting started? See our beginners’ guide for FX traders
- What is your trading personality? Take our quiz to find out
- Join a free webinar and have your trading questions answered
--- Written by Thomas Westwater, Analyst for DailyFX.com
To contact Thomas, use the comments section below or @FxWestwater on Twitter


