


Indices Technical Forecast: Bearish
- S&P 500 below important March trend-line
- Dow Jones could be sub-30k soon
- Nasdaq 100 leading the way lower, 200-day MA in sight
S&P 500 Technical Forecast
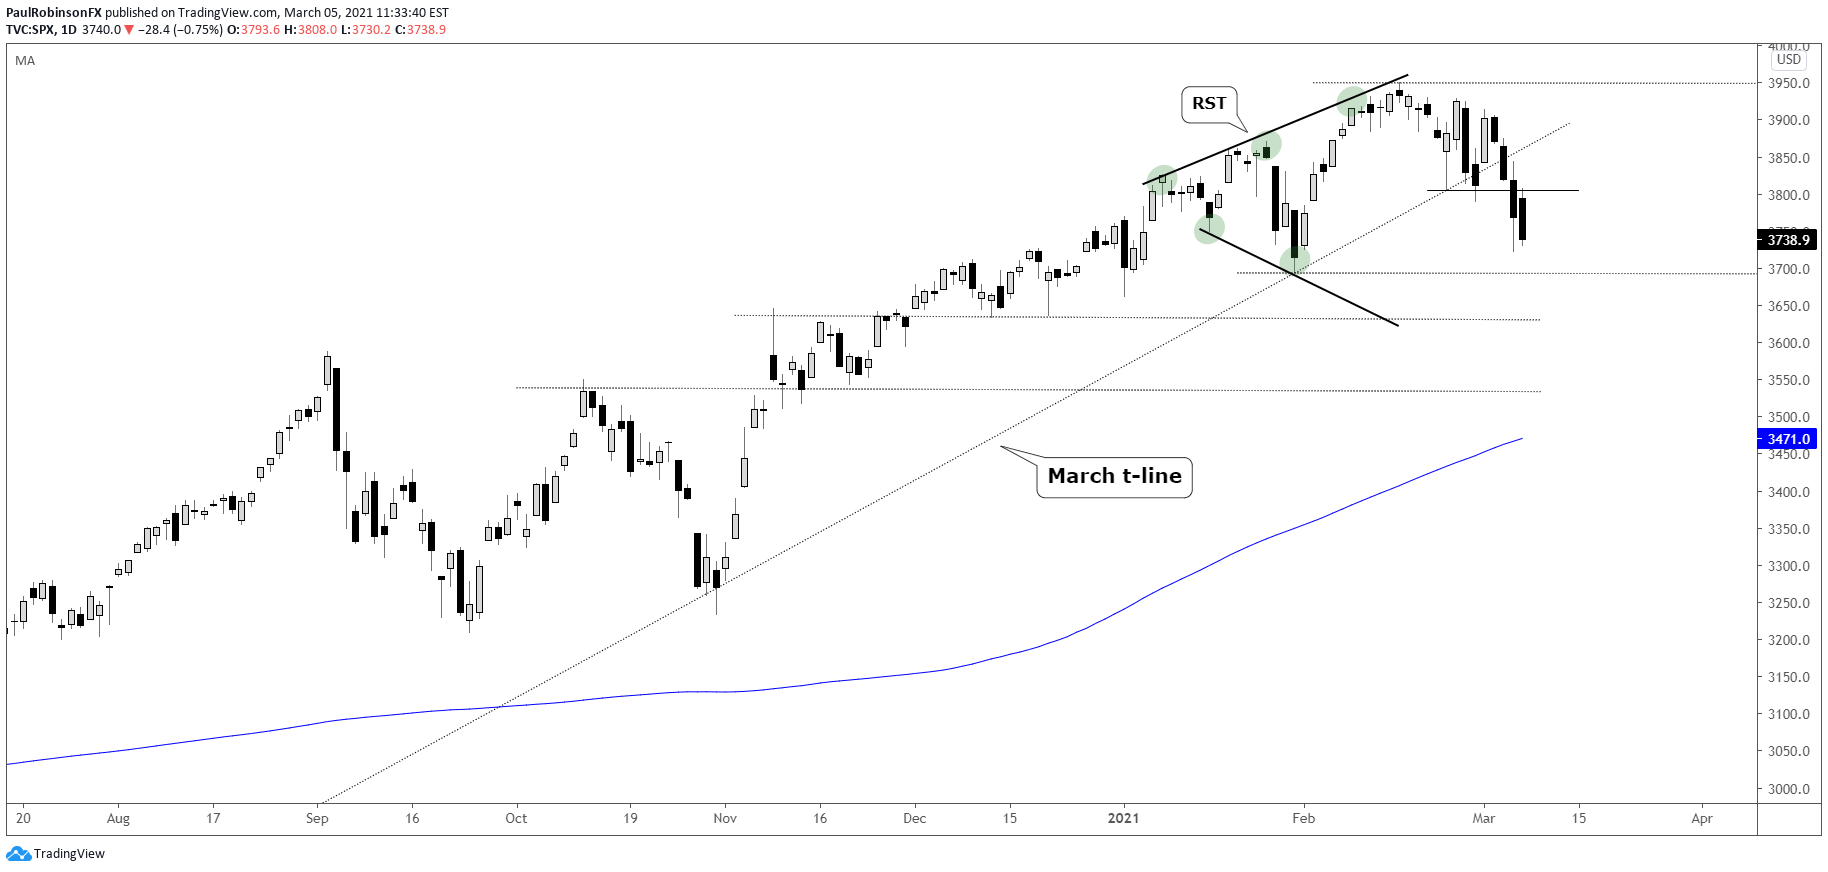
The S&P 500 broke the March trend-line last week, positioning itself for more losses. Given the size of the rally in the eleven months preceding the beginning of the current decline a broader sell-off looks warranted. This could have the 200-day or worse in play before all is said and done.
The RST pattern we had been looking at is in full-swing, with the 3694 low in focus. Beneath there lies some support around 3630, then around 3530 before arriving at the rising 200, currently at 3466. If the market is to continue towards the broader target it could take some time, perhaps a few weeks to fully play out.
S&P 500 Daily Chart (below march trend-line)
Dow Jones Technical Forecast
The Dow Jones is holding up the best of the big 3 (but about to break the March trend-line too), but if a risk-off move is to continue then it won’t be spared. The first minor level of support to watch clocks in around 29850, then 29568 (2020 high), followed by the rising 200-day at 28432. If the market can generally firm up here soon, given the relative strength the Dow is showing, it could be the best option for would-be longs.

Dow Jones Daily Chart (could soon lose the 30k mark)
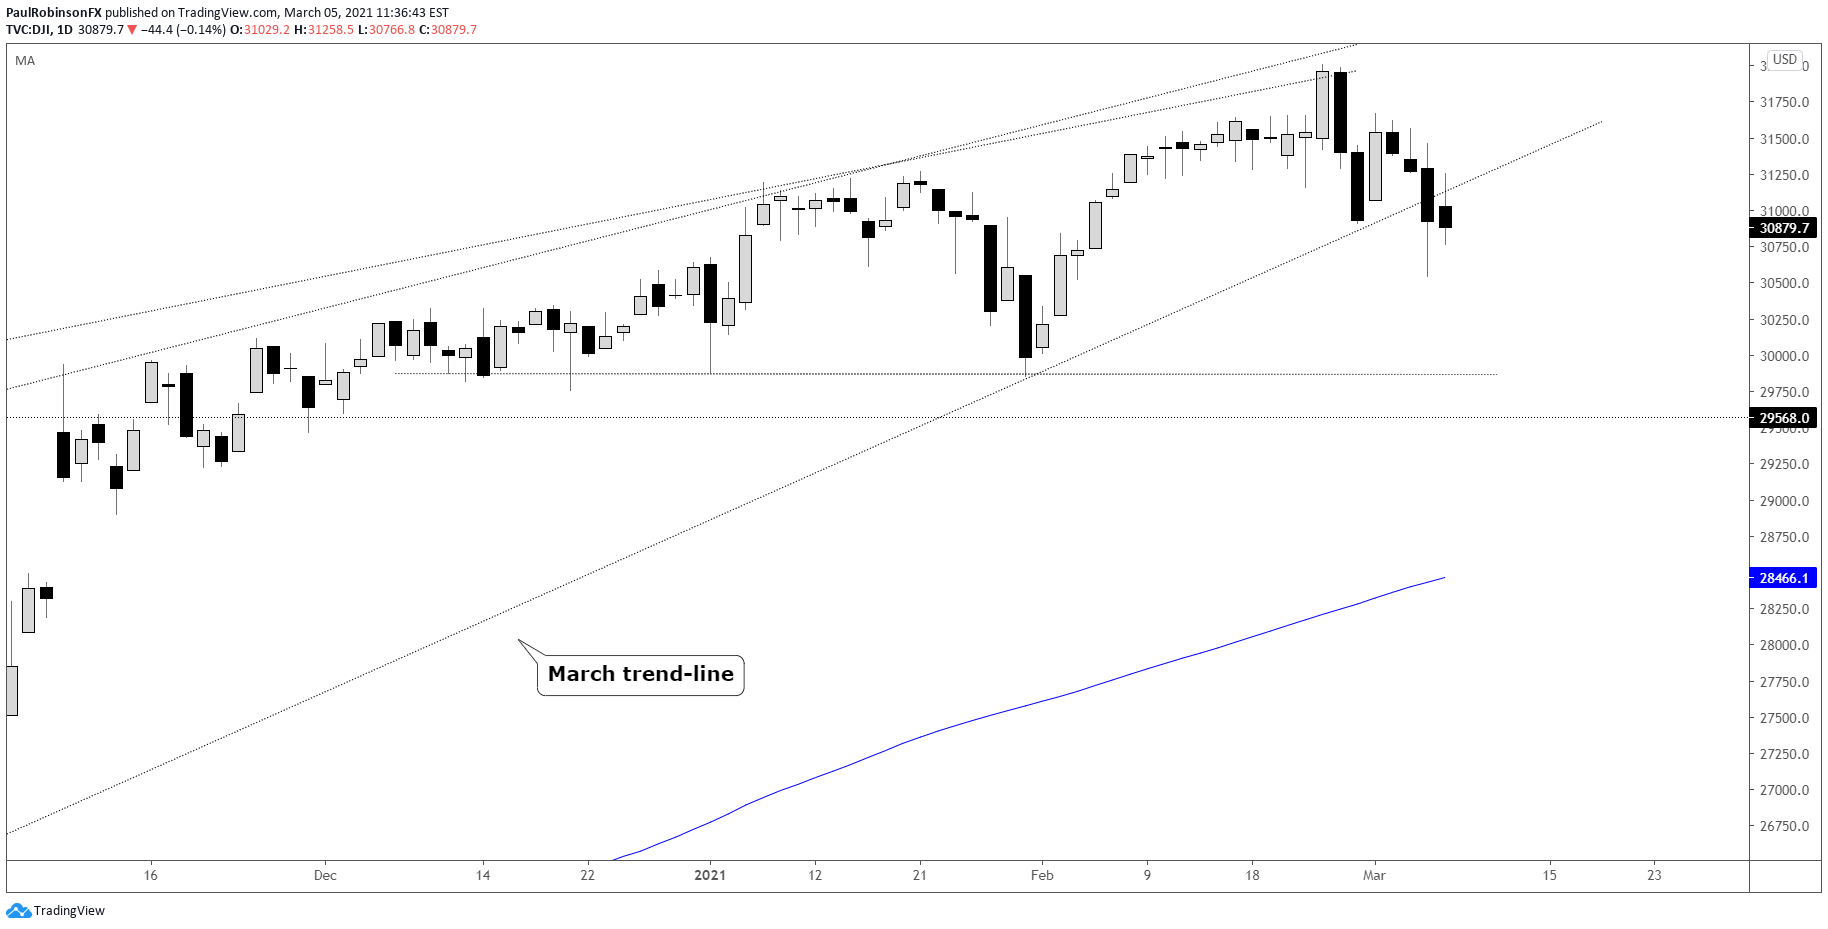
Dow Jones Chart by Tradingview
Nasdaq 100 Technical Forecast
The Nasdaq 100 is leading the broader market lower and is positioned to continue doing so. The head-and-shoulders pattern is in full-swing, and based on the height of the pattern the measured move target is in alignment with the 200-day, currently at 11656. To turn things around a good amount of work is needed at this juncture.
Nasdaq 100 Daily Chart (eyeing 200-day MA)
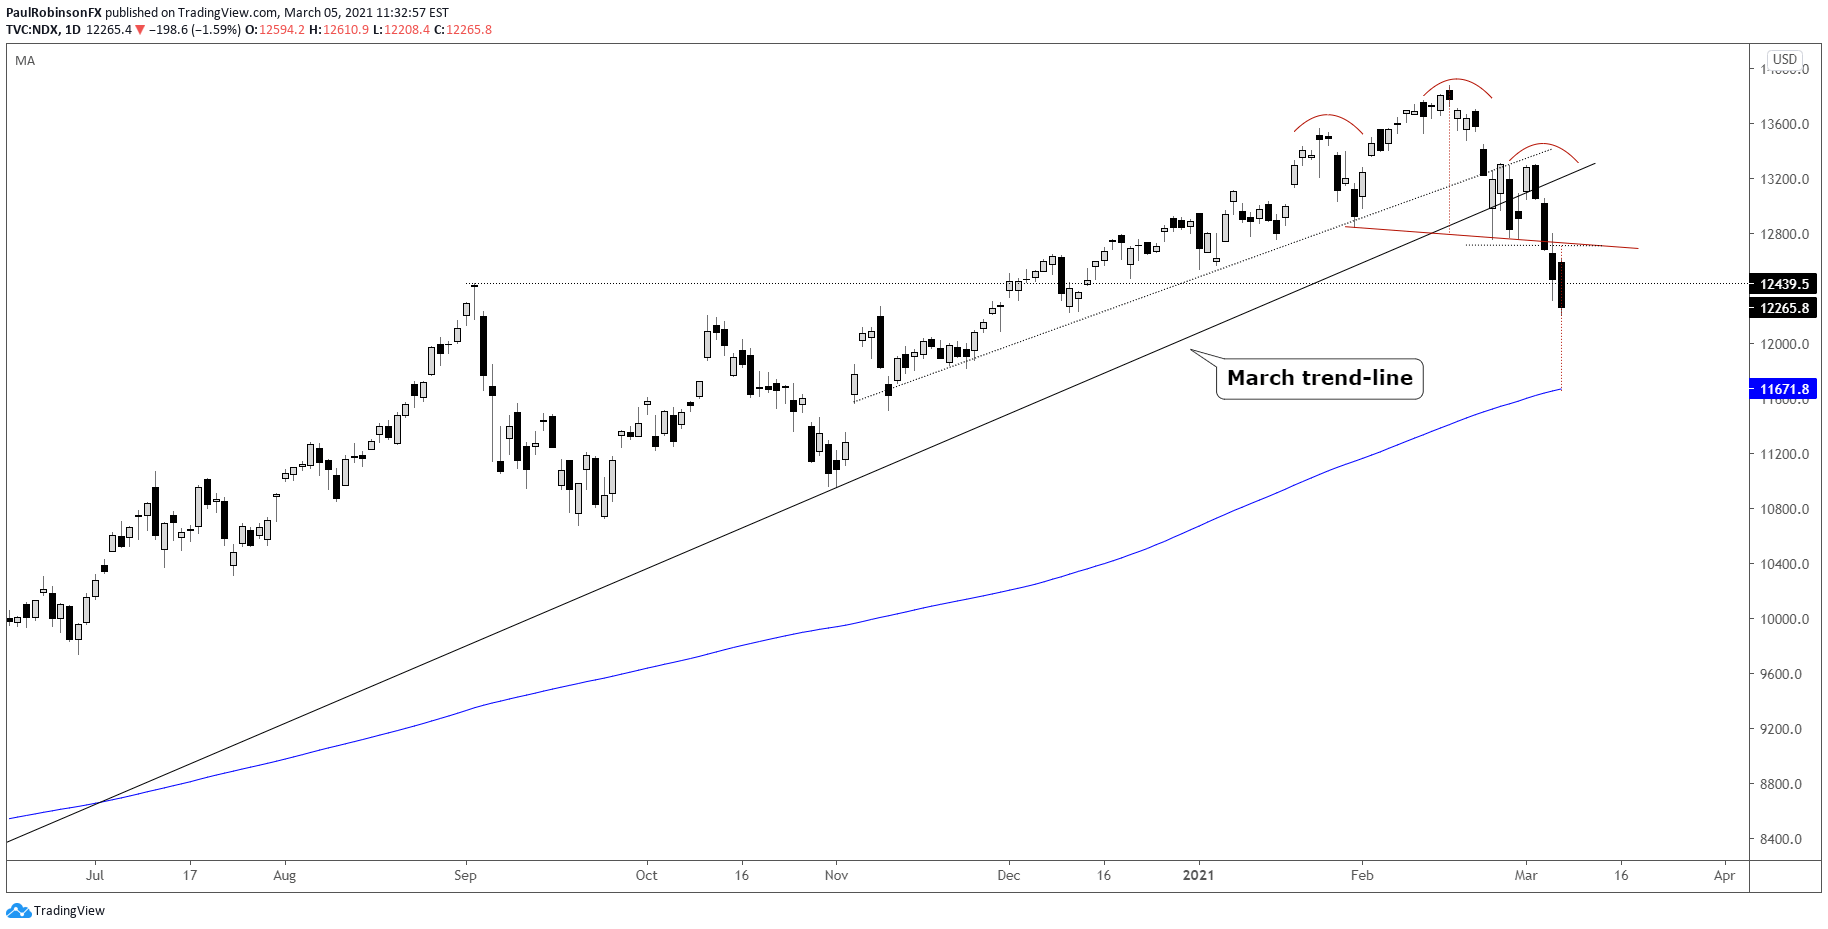
Nasdaq 100 Chart by Tradingview
Resources for Forex Traders
Whether you are a new or experienced trader, we have several resources available to help you; indicator for tracking trader sentiment, quarterly trading forecasts, analytical and educational webinars held daily, trading guides to help you improve trading performance, and one specifically for those who are new to forex.
---Written by Paul Robinson, Market Analyst
You can follow Paul on Twitter at @PaulRobinsonFX


