


US DOLLAR WEEKLY TECHNICAL OUTLOOK: DXY, EUR/USD, GBP/USD, AUD/USD
- US Dollar staged a noteworthy rebound this past month alongside rising market volatility
- EUR/USD price action has weakened recently as the relative strength index trends lower
- GBP/USD struggling to surmount the 1.3700-level, AUD/USD edging lower to test support
- Visit the DailyFX Education Center to learn about technical analysis and chart patterns
The US Dollar traded on its front foot throughout most of January in a rebound attempt off 34-month lows. On balance, the broader DXY Index recorded a 0.71% monthly gain.US Dollar strength seemed to correspond with an increase in demand for safe-haven currencies as market sentiment deteriorated and volatility accelerated.
This relationship is highlighted by the generally strong positive correlation between the DXY Index and S&P 500-derived VIX Index. US Dollar bulls could find motivation to make another advance if trader risk appetite continues to soften and propels the VIX ‘fear-gauge’ higher. However, it is likely that US Dollar selling pressure would resume if there is a retracement lower in the VIX Index from current levels.
DXY & VIX INDEX OVERLAID PRICE CHART: DAILY TIME FRAME (24 AUG 2020 TO 29 JAN 2021)

Chart by @RichDvorakFX created using TradingView
Looking at a daily chart of the US Dollar Index we can see that an inverse head-and-shoulder pattern appears to have formed. This brings bullish reversal potential into focus, which could be confirmed by a breakout above the 91.10-price level. Overcoming this obstacle might tee up a quick move to the 92.00-handle roughly underpinned by the 100-day simple moving average.
Although, the US Dollar is currently contending with technical resistance posed by its negatively sloped 50-day simple moving average. Not to mention, the upper Bollinger Band may continue keeping a lid on bouts of US Dollar strength. Odds of a sustained rebound could be undermined if the DXY Index fails to defend its bullish short-term trendline connecting the string of higher lows since 06 January.

EUR/USD PRICE CHART: DAILY TIME FRAME (21 OCT 2020 TO 29 JAN 2021)
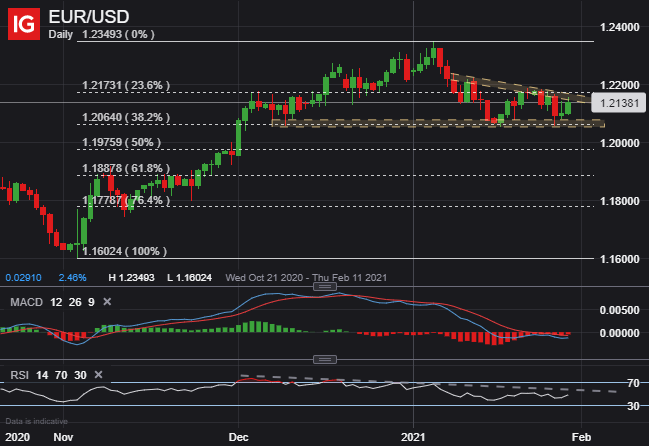
The direction of the broader US Dollar stands to mirror EUR/USD price action. This is owing to the fact that EUR/USD is the largest component of DXY Index performance with a 57.6% weighting. As such, it is unsurprising that the US Dollar has staged a rebound with EUR/USD weakening nearly 200-pips from its recent swing high.
EUR/USD price action could continue facing downward pressure as the relative strength index points lower and emphasizes the short-term bearish trend. Confluent support highlighted by the 38.2% Fibonacci retracement on the chart above has proved formidable so far, however. This area might help keep EUR/USD afloat going forward.
Eclipsing the 22 January close, perhaps coinciding with a bullish MACD crossover, could invalidate the short-term downtrend and put a retest of year-to-date highs back on the table. On the other hand, taking out the January lows may correspond with a deeper pullback toward the psychologically-significant 1.2000-price level before the 1.1800-handle comes into consideration.

GBP/USD PRICE CHART: DAILY TIME FRAME (05 OCT 2020 TO 29 JAN 2021)

GBP/USD price action trades roughly flat year-to-date after carving out a volatile 308-pip trading range throughout January. Bullish momentum behind the Pound-Dollar has sputtered out around the 1.3700-handle, but in light of continued higher lows, an ascending triangle pattern seems to have developed.
This formation highlights a period of consolidation and brings to focus potential for a continuation of the existing uptrend. The weekly implied high of 1.3862 might serve as a possible topside objective, which is derived from GBP/USD one-week implied volatility of 8.1%.
If US Dollar bulls can push GBP/USD price action below its 20-day simple moving average, however, a deeper pullback could come into play. Breaching this nearside support level may find the 11 January swing low and bottom Bollinger Band eyed as the next potential layer of defense.
| Change in | Longs | Shorts | OI |
| Daily | 3% | -7% | -3% |
| Weekly | 4% | -10% | -5% |
AUD/USD PRICE CHART: DAILY TIME FRAME (23 OCT 2020 TO 29 JAN 2021)

AUD/USD price action has been gravitating lower since the start of the year. The sentiment-linked Australian Dollar could remain under pressure against its US Dollar peer if market volatility stays elevated. Forex options traders appear to have a bearish bias toward AUD/USD judging by its one-week risk reversal, which has turned increasingly negative and currently hovers at its lowest reading since 04 November.
That said, the 175-pip decline from its January high leaves AUD/USD flirting with a critical level of support near the 0.7625-mark. This area of buoyancy is highlighted by the 50-day simple moving average and 23.6% Fibonacci retracement on the chart above.
Failing to maintain this level might motivate AUD/USD bears to set their sights on the 100-day simple moving average around the 0.7400-handle. Invalidating the downtrend extended through the latest stretch of lower highs could recharge Aussie bulls and fuel a move back toward the 0.7800-level.
-- Written by Rich Dvorak, Analyst for DailyFX.com
Connect with @RichDvorakFX on Twitter for real-time market insight


