


AUSTRALIAN DOLLAR TECHNICAL FORECAST: BEARISH
- AUD/USD breakdown may occur after retesting broken support level
- AUD/CAD aims lower after rejection at Descending Triangle resistance

AUD/USD Technical Forecast: Bearish
The Australian Dollar’s technical posture has deteriorated considerably against the US Dollar and may be on course to weaken further.AUD/USD descended through a support line formed by the bottom of a Symmetrical Triangle last week, with a subsequent drop to the 61.8% Fibonacci retracement level.
Prices retraced higher but strength tapered off at the 38.2% Fib level, which sits just abovethe triangle’s lower bound. The pair then turned lower. The rejection turns support into resistance and lends a degree of validation to the bearish reversal signal. AUD/USD now appears poised for further losses, with the 61.8% Fib level possibly serving as a price target for sellers.
However, an extension lower – perhaps to the 78.6% Fib – may take place if last week’s low gives out. Intermediate support via the 50-day Simple Moving Average is a possible point of price contention. Another outcome would be a move back above the triangle's trendline, invalidating the reversal signal in turn. On balance, a bearish near-term outlook seems to be the most probable path forward.
AUD/USD 4-Hour Chart
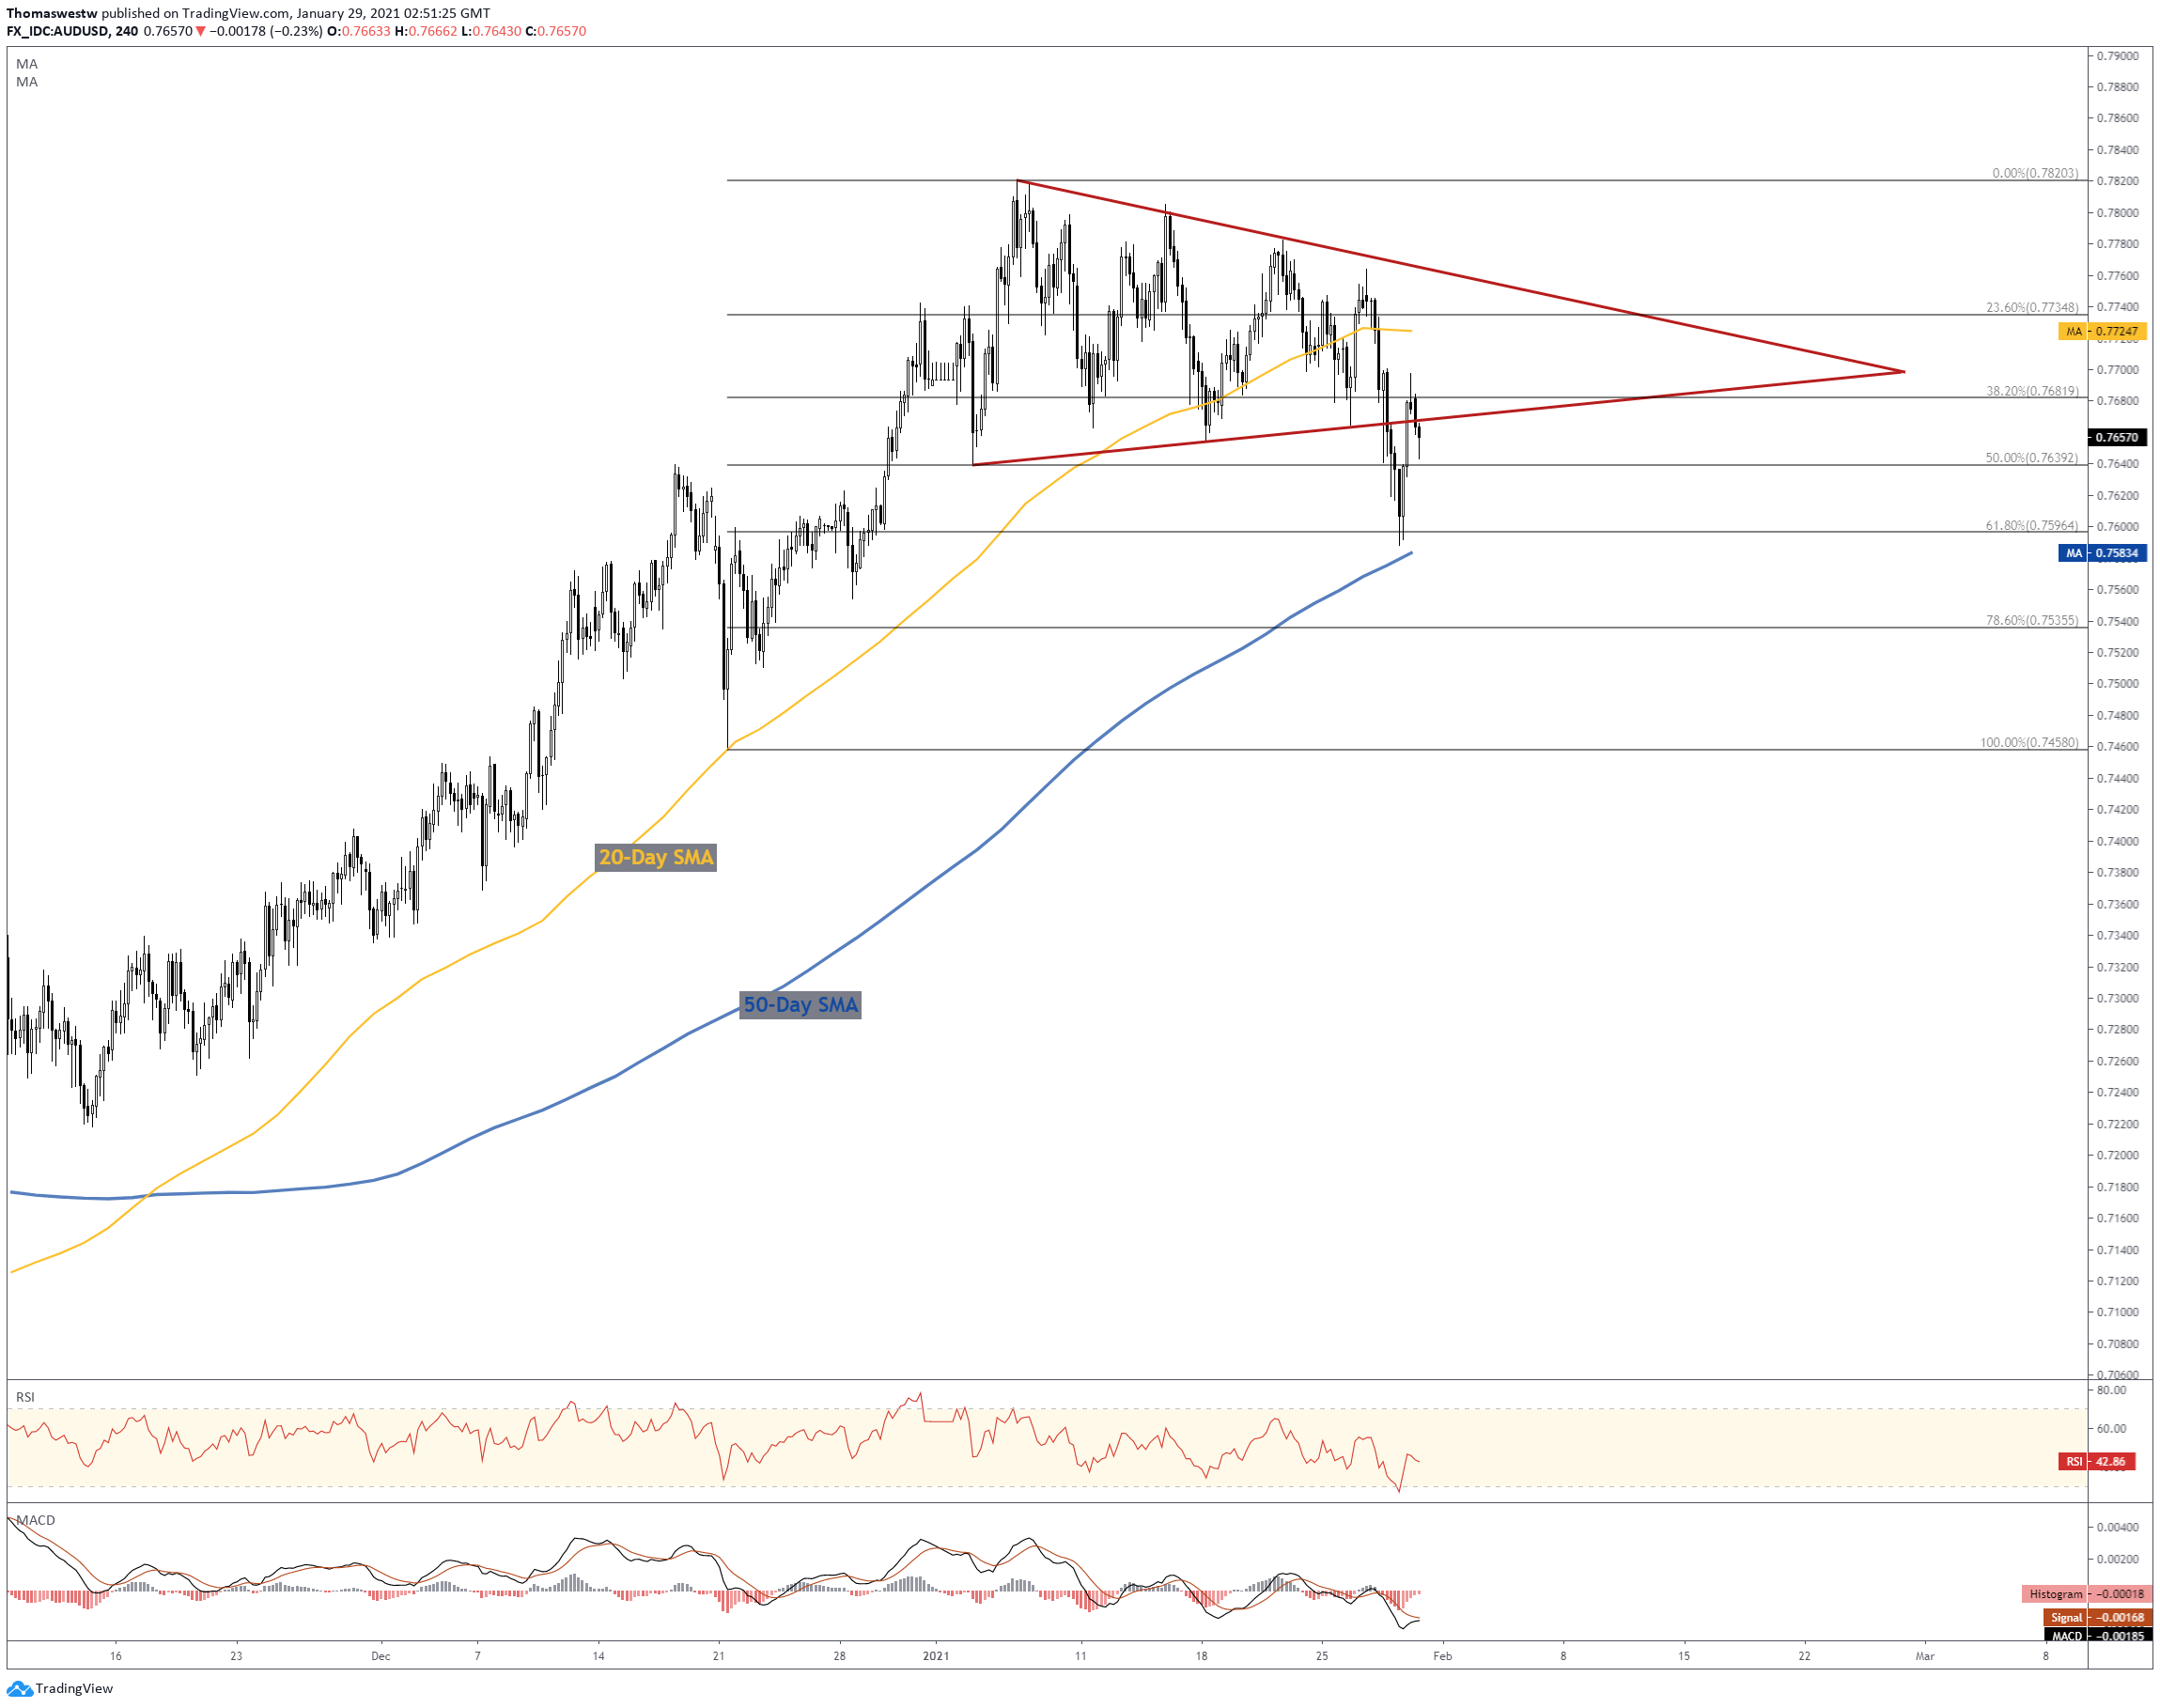
Chart created with TradingView
AUD/CAD Technical Forecast: Bearish
The Australian Dollar is in a more neutral stance against its Canadian namesake, although a slight bearish bias exists as a Descending Triangle pattern sets up a possible reversal. Prices have dragged lower over the last few weeks, putting in a series of lower highs to form the downward sloping trendline.
The latest swing high formed after the pair rallied from the triangle's horizontal support. AUD/CAD is now attempting to break to the downside to open the door for another test of key support and a potential longer-lasting selloff. The 20-day SMA and 23.6% Fibonacci retracement – both anterior to the horizontal trendline – may supply potential support levels.
Overall, a bearish outlook appears to be the likely avenue in the short term. The alternate case, while less likely, would see prices climb and surmount resistance, giving way to the longer-term trend. Waiting for an exit from the Triangle pattern seems like a prudent approach, all things considered. The 38.2% Fib level along with channel support from the October 2020 swing low may be likely price targets if a breakdown does occur.
AUD/CAD 4-Hour Chart

Chart created with TradingView

AUD/USD, AUD/CAD TRADING RESOURCES
- Just getting started? See our beginners’ guide for FX traders
- What is your trading personality? Take our quiz to find out
- Join a free webinar and have your trading questions answered
--- Written by Thomas Westwater, Analyst for DailyFX.com
To contact Thomas, use the comments section below or @FxWestwater on Twitter


