


GBP/USD, EUR/GBP Technical Forecast – Talking Points
- GBP/USD rally in question as prices test Rising Wedge trendline resistance
- Falling Wedge in EUR/GBP forms after prices break below Symmetrical Triangle
- The recent strength in the British Pound may have Sterling bulls off-guard for now

GBP/USD Technical Forecast: Bearish
The British Pound gained 0.75% versus the US Dollar this past week as traders turned bearish on the Greenback after Treasury Secretary nominee Janet Yellen affirmed the nation’s commitment to maintain a market-priced Greenback. As a result, GBP/USD rose to test the upper bound of a Rising Wedge pattern, breaking above the 1.3700 psychological level in the process.
GBP/USD may continue to trend higher alongside resistance, although the 78.6% Fibonacci retracement level from the April 2018 to March 2020 move will come into play, adding another level of potential resistance. Above that, the 1.3800 psychological level will move into focus. These levels are likely to provide resistance even if prices moves outside of the pattern.
Alternatively, a move lower could see prior resistance turn into potential support at the 1.3700 psychological level. The wedge’s support line is the pertinent focal point to the downside, with the 9-day Exponential Moving Average (EMA) and the 20-day Simple Moving Average (SMA) furnishing levels of intermediate support.
GBP/USD Daily Chart

Chart created with TradingView
EUR/GBP Technical Forecast: Neutral
EUR/GBP tested trendline support of a Falling Wedge last week before rebounding to finish the week nearly unchanged. Before testing support, prices fell below a multi-month support level, recording the lowest price since mid-May 2020. The cross is now near its mid-point within the wedge pattern, with the 9-day EMA (blue line) and 50% pseudo-Fibonacci retracement level from the February – March 2020 move proving to be an area of contention.
The Falling Wedge pattern, in contrast to the Rising Wedge discussed above, is inherently bullish. Granted that, EUR/GBP may continue to decline within the pattern as price action develops. Last week’s low at 0.8829 will likely be a decisive level for Euro bulls to defend. However, if Sterling strength prevails, a drop to the 61.8% Fib level, which coincides with an area of major support from early 2020, may unfold.
EUR/GBP’s current panorama has the wedge’s resistance line in clear focus. A move higher will either pierce through the triangle or find rejection and veer lower, with the former possibly giving way to a breakout. Interestingly enough, however, trendline support from a broader Symmetrical Triangle may turn into resistance. Nonetheless, prices would still have a path to trend higher, but a clean breakout could see EUR/GBP extend up to the 38.2 Fib level, just below the triangle’s apex.
EUR/GBP Daily Chart
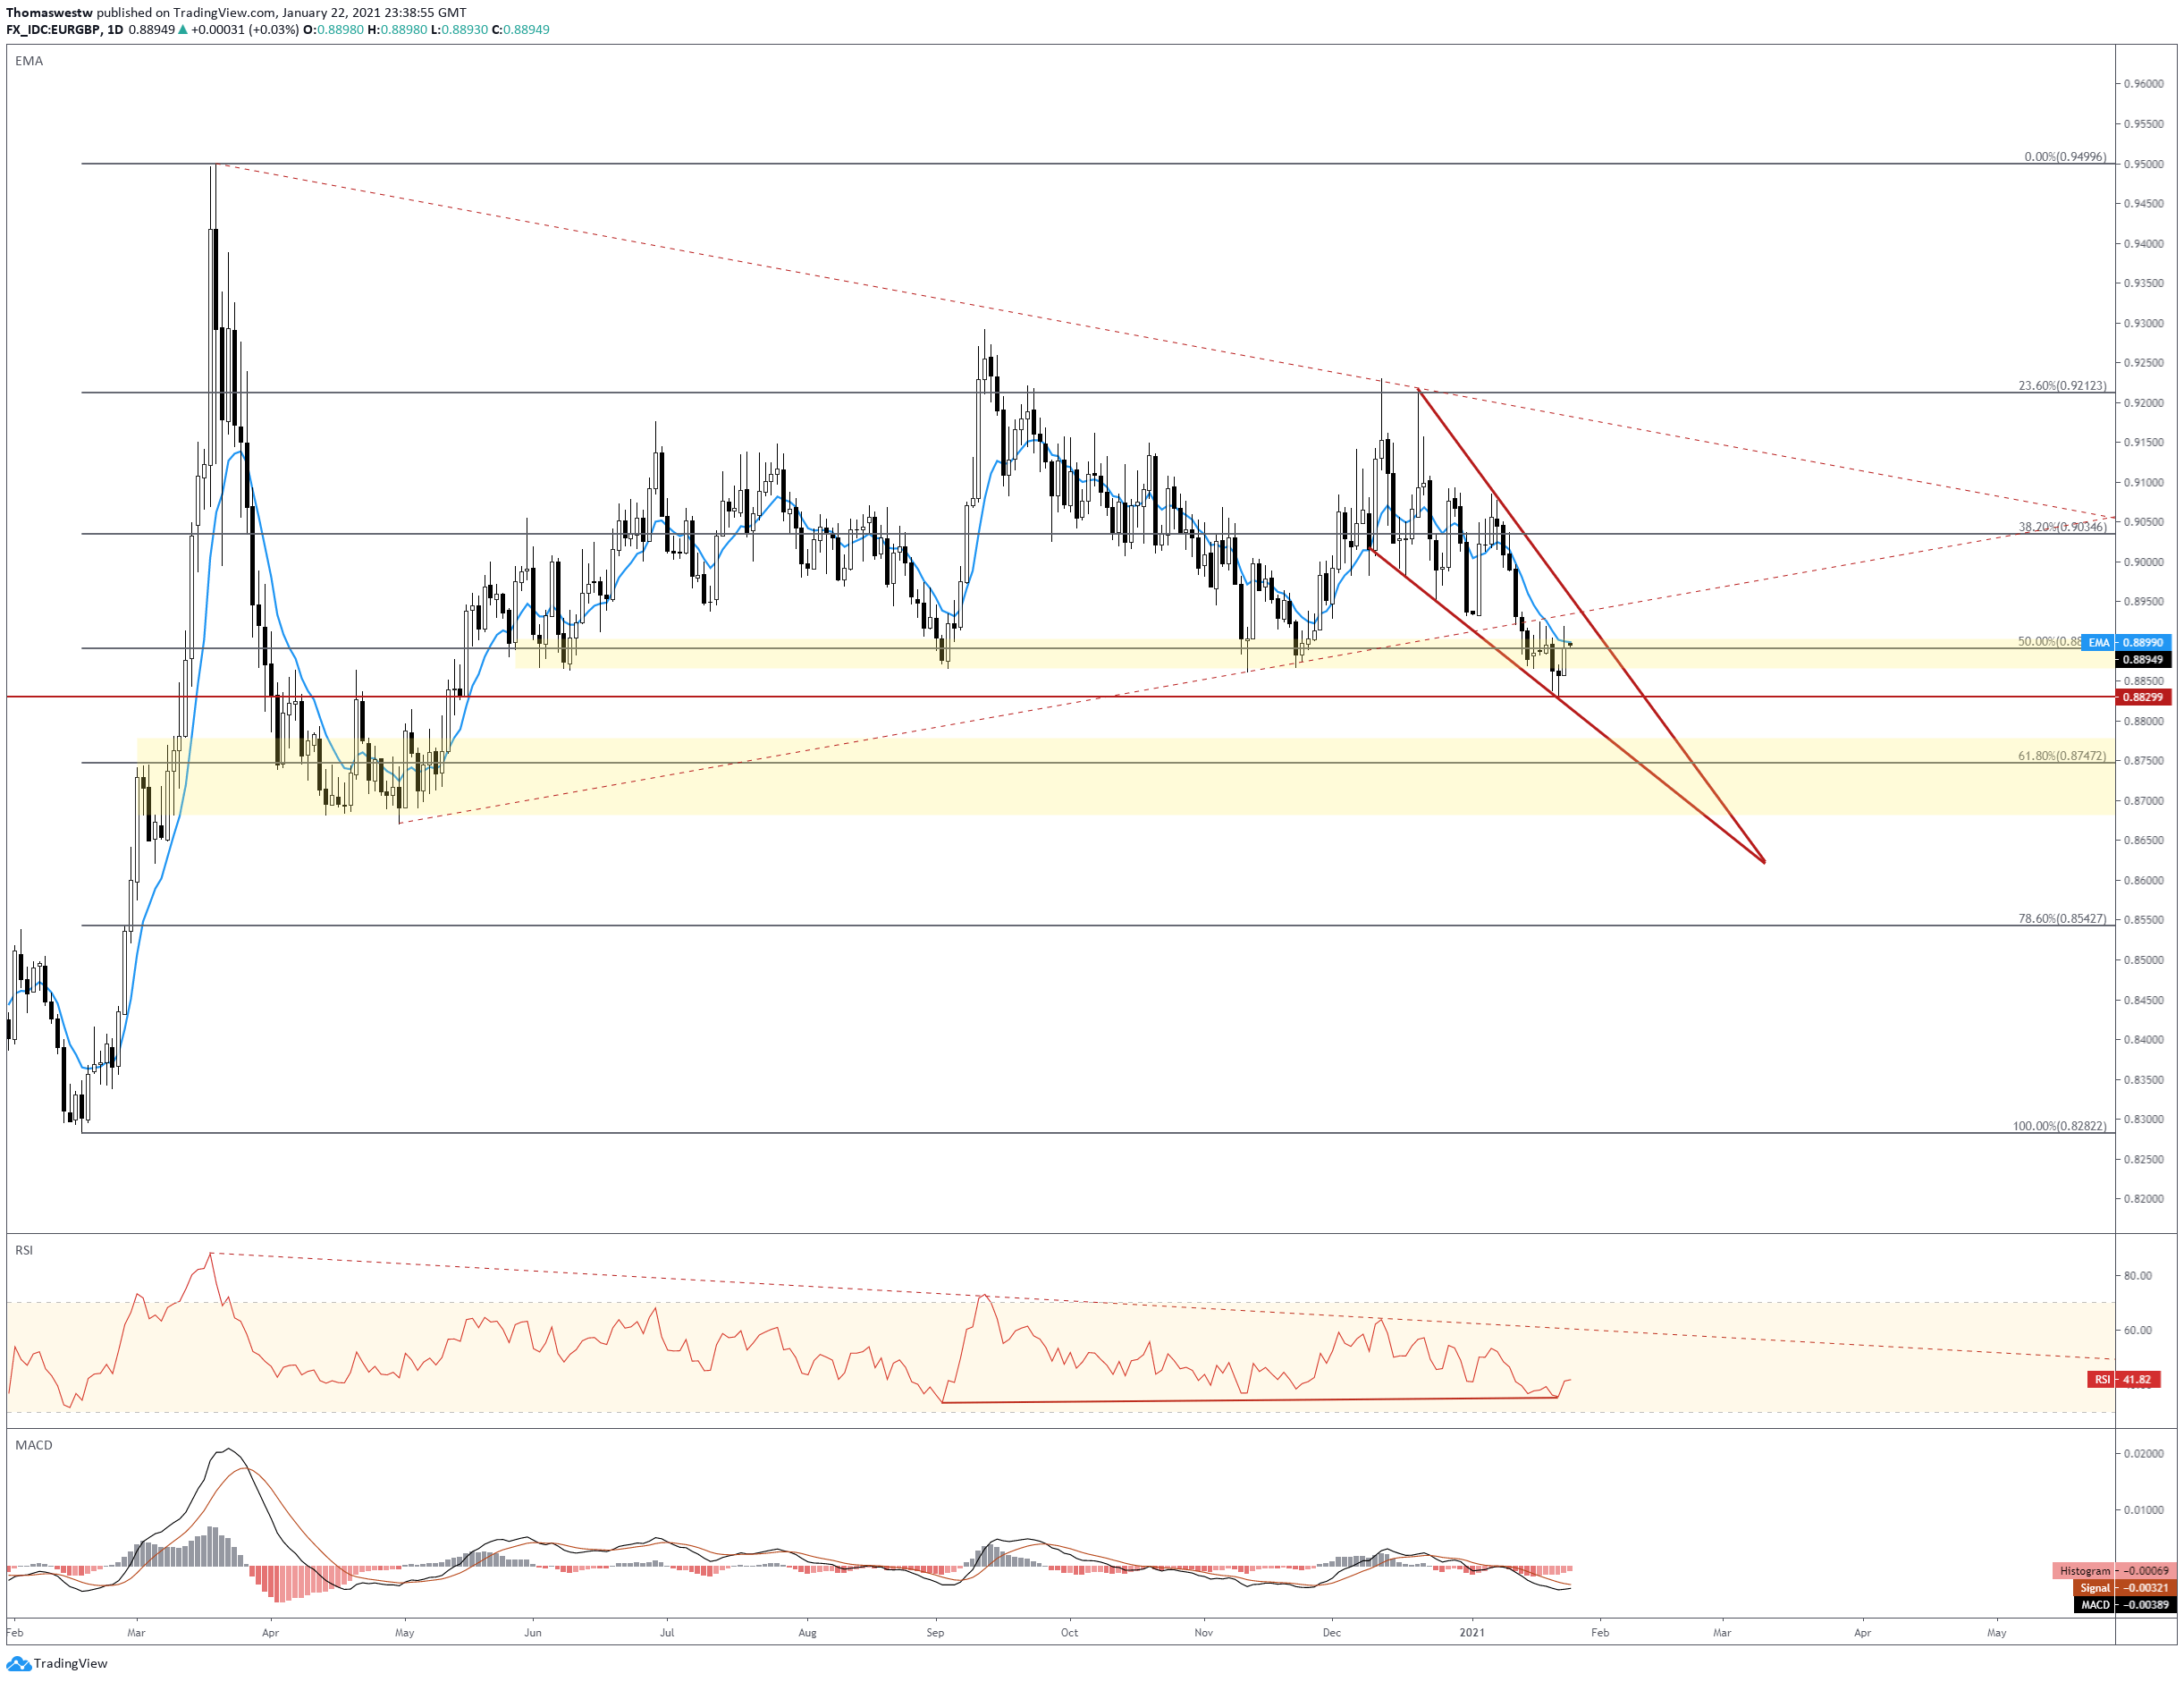
Chart Created with TradingView
GBP/USD, EUR/GBP TRADING RESOURCES
- Just getting started? See our beginners’ guide for FX traders
- What is your trading personality? Take our quiz to find out
- Join a free webinar and have your trading questions answered
--- Written by Thomas Westwater, Analyst for DailyFX.com
To contact Thomas, use the comments section below or @FxWestwater on Twitter


