


USD/MXNTechnical Forecast: Neutral
Not much has changed in the USD/MXN daily chart since I talked about it last week. In fact, current price remains in the same place where I last left it.
USD/MXN Daily chart
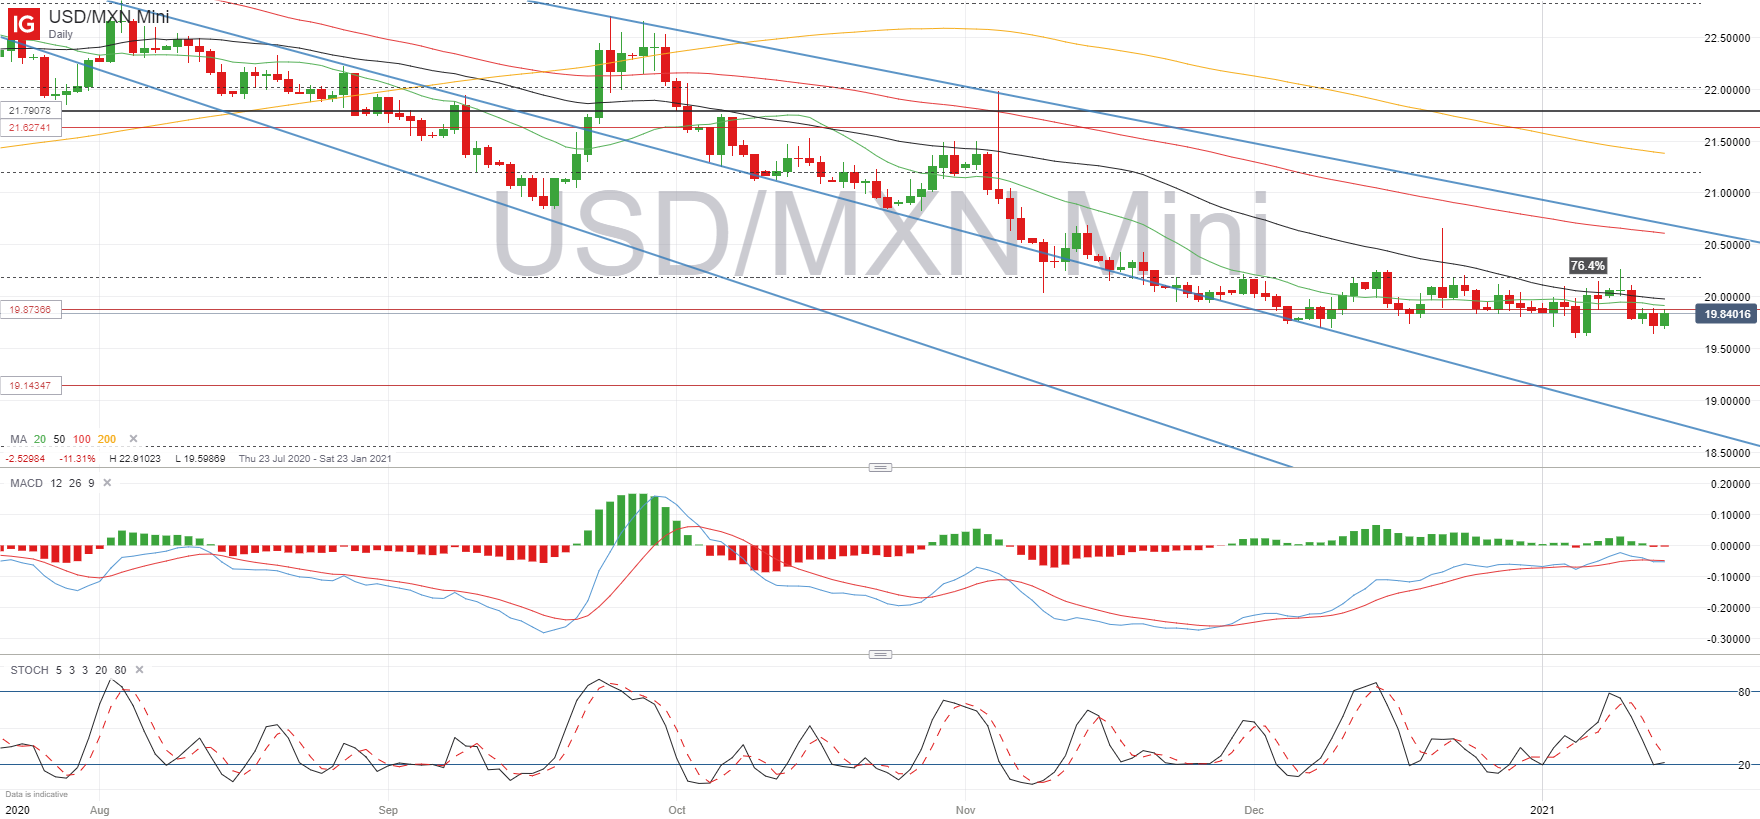

A recovery in the US Dollar from two-a-half-year lows saw USD/MXN pick up slightly towards the end of the first week of January, continuing positive momentum into the first part of this past week. In a new three-week high seen on Monday, the pair seemed ready to push above the 76.4% Fibonacci resistance (20.18) but it lacked enough support and topped out at 20.26 before reversing back to the ten-month low at 19.60.
The Dollar is regaining positive momentum to end the week, which sees USD/MXN in a new attempt to break horizontal support-turned-resistance at 19.87. A break above this level is likely to increase bullish support, leading to a fresh attempt to advance above 20.18, which has been an upper bound for the most part of the last two months.
The Mexican Peso remains vulnerable to a risk-off move, meaning the US Dollar will be picking up safe haven momentum. If this occurs, I would look for a break above 20.50 to start considering price reversal, with a close above the 21.00 line as a confirmation of short-term bullish bias.

As I mentioned last week, the sideways range seen since the beginning of December shows a lack of bearish support at current levels, where multiple stops could have been triggered. This means the descending trendline is now further away from current prices, making it harder to form a strong bearish view.
Looking at technical indicators, the 20-day moving average has flattened out and could be about to cross the 50-day average in a sign that momentum is turning, whilst the stochastic is nearing the oversold area again after having been reset in the bullish correction at the beginning of the week.
--- Written by Daniela Sabin Hathorn, Market Analyst
Follow Daniela on Twitter @HathornSabin


