


USD/JPY Technical Forecast: Bullish
- USD/JPY started the week by continuing the prior week’s jump, but prices soon ran into a descending trendline.
- The remainder of the week was back-and-forth, and the net of this week’s price action is shaping up to be a doji in USD/JPY. But – there may be potential for breaks on the horizon as a candlestick pattern has built on longer-term charts.
- The analysis contained in article relies on price action and chart formations. To learn more about price action or chart patterns, check out our DailyFX Education section.
I’m starting off with a monthly chart here because that’s really what’s needed to put into scope the importance of current support. The price of 103.11 is the 38.2% Fibonacci retracement of the 1998-2011 major move in the pair; and at 100.72 we have the 50% marker of the 2011-2015 major move. Of course, the 100.00 level is key as well, as this marks a theoretical type of ‘parity’ value in USD/JPY. Collectively, the zone of prices from around 100.00 up to the 103.11 have had a historical appeal in the pair, setting resistance in 2013 before becoming support in 2014 and again in 2016.
More recently, this zone came into play last March and again in November/December of last year. Longer-term, this sets up a big picture descending triangle in the pair, and this is a big part of why I had chosen the bearish side of USD/JPY as my ‘top trade idea for 2021,’ which you can access from the link below:

USD/JPY Monthly Price Chart
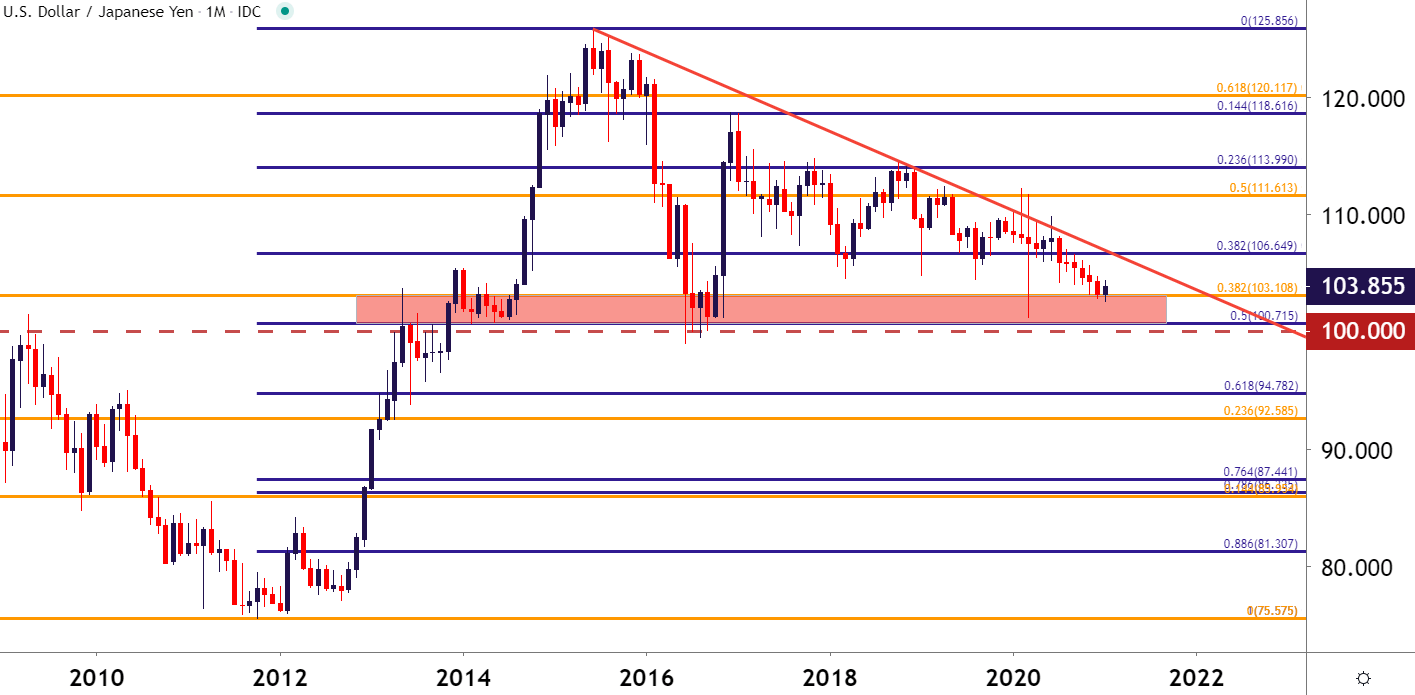
Chart prepared by James Stanley; USDJPY on Tradingview
USD/JPY Runs into Trendline Resistance
This big picture support zone or, more specifically, the Fibonacci level marking the top of this zone at 103.11 has been seeing an increasing frequency of tests and, until last week, that was coupled with a series of lower-highs, keeping the door open to breakdown potential.
But the second-half of last week saw a bullish spurt in the pair that brought on a higher-high and higher-low. That strength extended into this week until price action ran into a descending trendline, finding resistance before stalling into the end of the week. This trendline can be found by connecting the swing highs from March and June of last year, the projection of which caught the Monday high.
But, there’s another consideration here and that’s a trendline sitting underneath recent price action, which connects July and November swing lows from last year, and that projection caught last week’s low. The net of these two trendlines is falling wedge pattern which, unlike the descending triangle from the longer-term chart looked at above, will often be approached with the aim of bullish reversals.
To learn more about falling wedges, join us in DailyFX Education
If you’d like to learn more about descending triangles, this article goes into depth
And if you’d like to learn more about trendlines, this article can help
USD/JPY Daily Price Chart
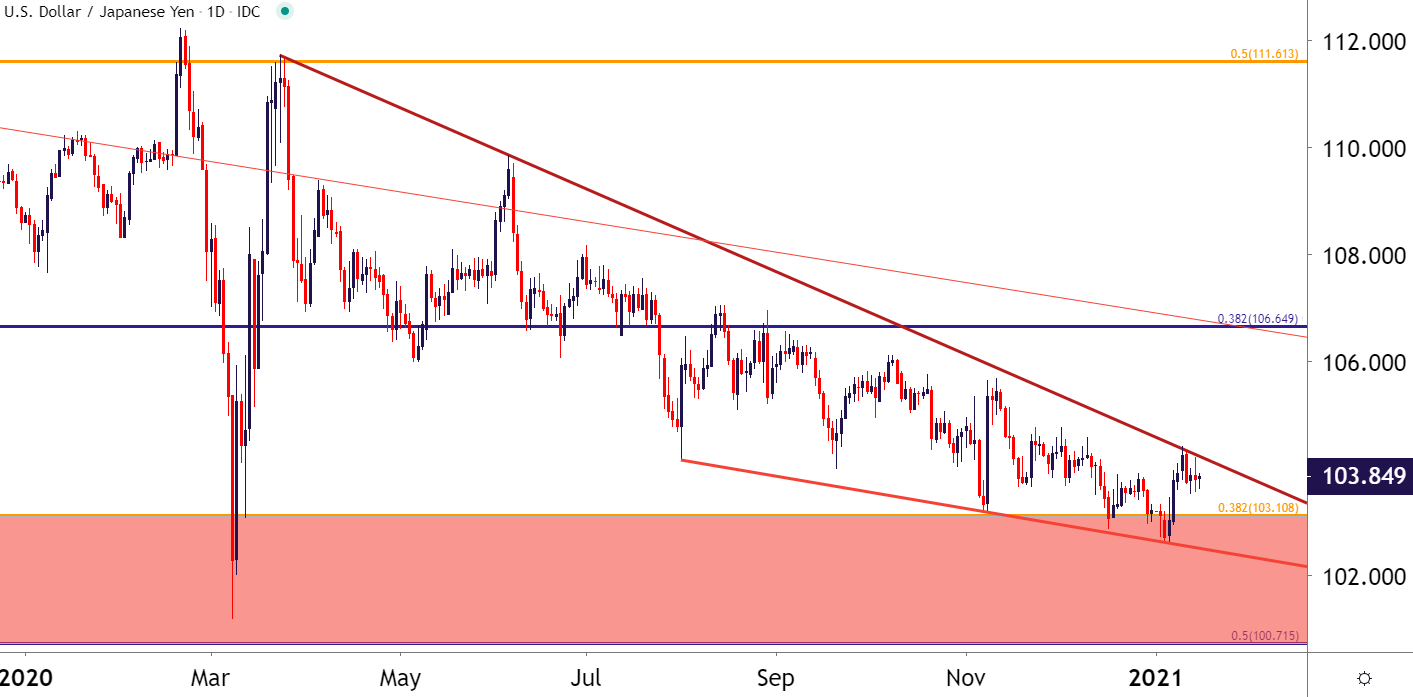
Chart prepared by James Stanley; USDJPY on Tradingview
Bullish or Bearish – Which Formation to Follow?
A series of conflicting signals is a situation that traders invariably need to address because, it happens. So from the longer-term chart (and my rationale for looking at short USD/JPY this year) highlights a descending triangle nested around a big spot of support.
The shorter-term chart, as shown on the Daily above, highlights a bullish formation, in the exact opposite direction of the longer-term, bigger picture move.
Should a trader ignore one and favor another? Or, perhaps, is there a way to reconcile this divergence?
In this case, I believe that there is, and that would be looking at short-term bullish biases, showing initial favor to the nearer-term setup taken from the Daily chart; but then looking for that to work in concert with the bigger-picture look, which would entail a hold of any prevailing bullish breakout below longer-term resistance levels. Going to the weekly chart, this highlights potential interest around the 105.00 psychological level, or perhaps even as deep as the 106.65 Fibonacci level. Resistance showing at either of those points could quickly re-open the door to bigger-picture bearish strategies. But, until then, be cautious of the potential for near-term bullish continuation should this falling wedge give way to rising prices.
The forecast for next week will be set to bullish.
USD/JPY Weekly Price Chart
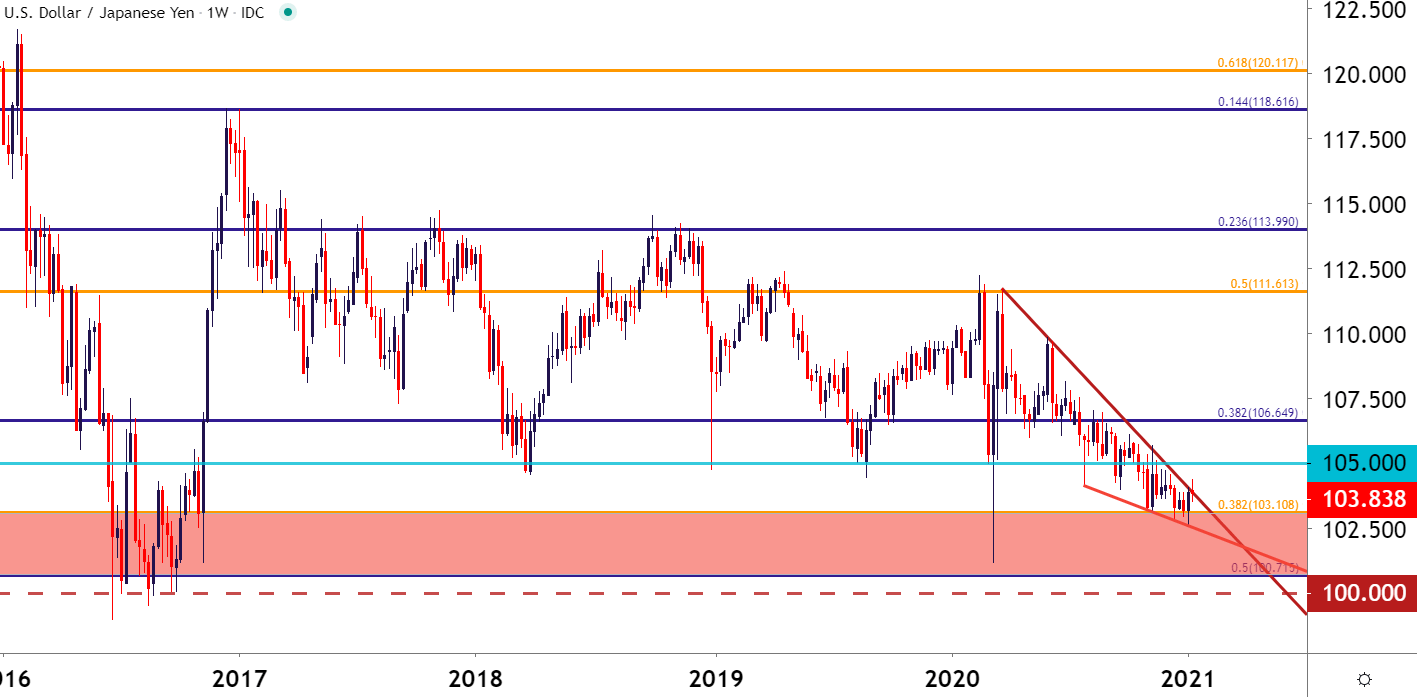
Chart prepared by James Stanley; USDJPY on Tradingview
--- Written by James Stanley, Strategist for DailyFX.com
Contact and follow James on Twitter: @JStanleyFX


