


Crude Oil Technical Forecast – Neutral
- Crude oil prices attempting to push higher post resistance breakout
- Doji on weekly setting hints at indecision, moving averages do not
- Momentum fading on the daily chart as prices eye February highs
WTI crude oil prices may be setting the foundations for a further push to the upside heading into the last few weeks of 2020. On the weekly chart below, oil has climbed above the 42.40 – 45.15 inflection zone that was established back in late 2018 when prices bottomed about two years ago. This has subsequently exposed the former 50.63 – 53.58 support zone which could come into play as new resistance.
A couple of fundamental drivers pushing energy prices higher recently are a combination of OPEC+ tapering projections for 2021, US fiscal stimulus expectations and the early phases of a rollout in a Covid vaccine. Now, prices have also climbed above the 20-period and 50-period Simple Moving Averages (SMAs) on the weekly chart below. Underpinning support to the upside is a bullish ‘Golden Cross’ formed by the SMAs.

However, a Doji candle seems to have been established which is a sign of indecision. At times, this candle can signal a turning point depending on the location. In this case, it may hint at a top, especially if prices decline in the coming weeks. Further gains on the other hand would overturn the implications of this candlestick pattern, opening the door to an upside focus.
WTI Crude Oil Weekly Chart
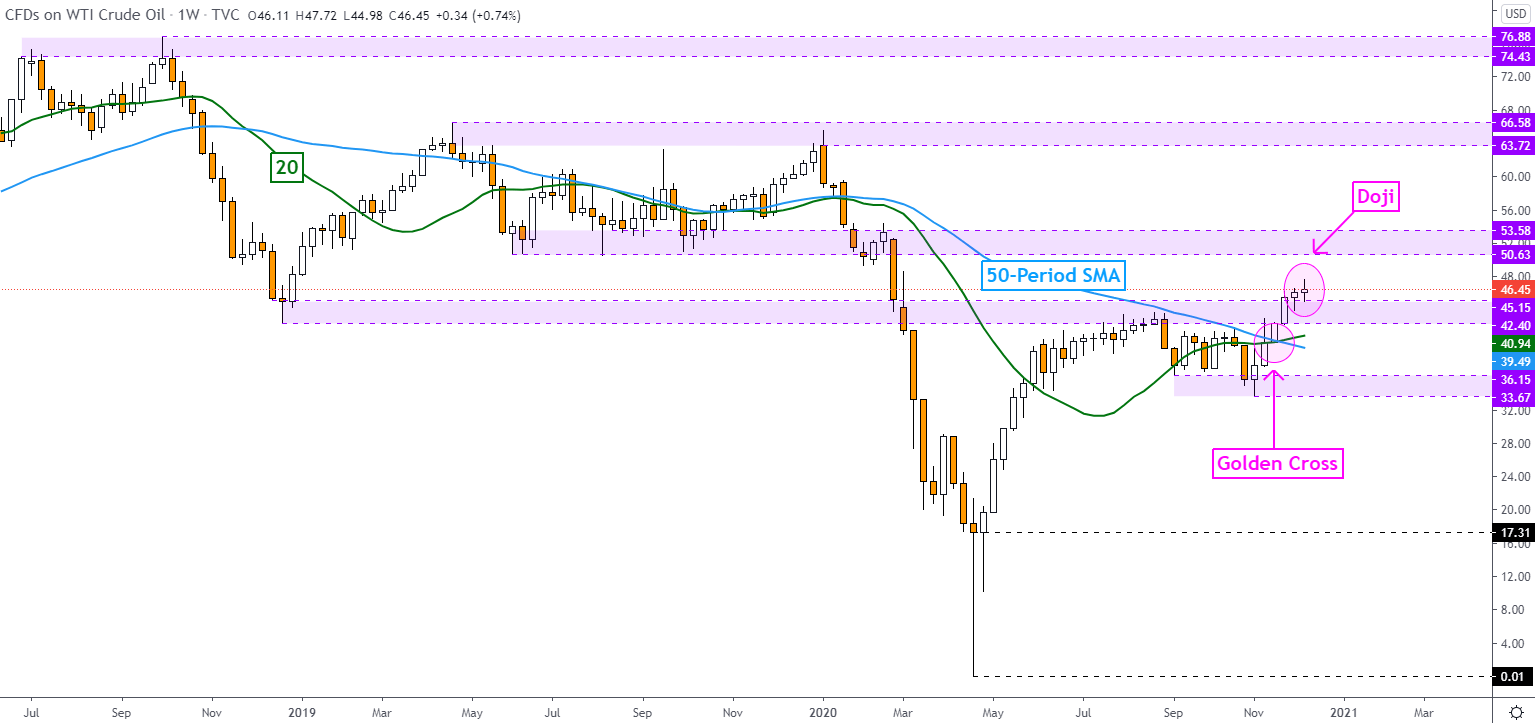
Crude Oil Chart Created in TradingView
Crude Oil Technical Outlook
Zooming in on the daily chart for a more immediate picture, I have pointed out negative RSI divergence, a sign of fading upside momentum. This can at times precede a turn lower and such an outcome could place the focus on the 20-day and 50-day SMAs which have also formed a Golden Cross recently. These offer conflicting signals after prices pushed beyond the 41.60 – 43.75 resistance zone.
The December 10th candle was important as it closed above highs set in late November and earlier this month. However, the subsequent candle on Friday does not inspire confidence in confirming the breakout. As such, traders ought to take recent price action in crude oil prices with a grain of salt. In the event of a deeper pullback in energy prices, keep a close eye on the 33.66 – 36.15 support zone.
| Change in | Longs | Shorts | OI |
| Daily | 3% | -7% | 1% |
| Weekly | 31% | -38% | 7% |
WTI Crude Oil Daily Chart

Crude Oil Chart Created in TradingView
--- Written by Daniel Dubrovsky, Currency Analyst for DailyFX.com
To contact Daniel, use the comments section below or @ddubrovskyFX on Twitter


