


USD/MXN Technical Forecast: Bearish
It has been an interesting week for USD/MXN as the pair attempted to break lower but ended up reversing and pushing back up above the 20 mark.

The week started off with a new 9-month low at 19.69 whilst price action was keeping to the descending trendline resistance. But a push higher from the US Dollar on Wednesday was enough for USD/MXN to reverse price action and head higher for the next three sessions, likely tripping some short-term stops along the way.
This move higher isn’t necessarily a change in longer-term trend, as there is still a strong case for bearish pressure to continue, but as mentioned many times before, short-term reversals are expected in the continuation of longer trends. In fact, this push above the 20 line has only made the pair more attractive to new sellers, and the 76.4% Fibonacci at 20.18 is a good place to start.
This area is an important resistance line and a short-term correction back at the end of November already saw a rejection at this level. USD/MXN does seem to have solid technical trends, and we can expect this to continue going forward, so a break above 20.18 could trigger another round of bullish support sending the pair towards the 20.50 line, where the 50-day moving average converges.
USD/MXN Daily chart


But, if the path of least resistance continues to be lower, the 19.87 area is likely to offer renewed support, as will the psychological 20 mark. We would need to see USD/MXN below the descending trendline to consider a new retest of the 9-month lows, heading towards the 19.50 line, before topping with another key resistance area at 19.14.
USD/MXN Weekly chart
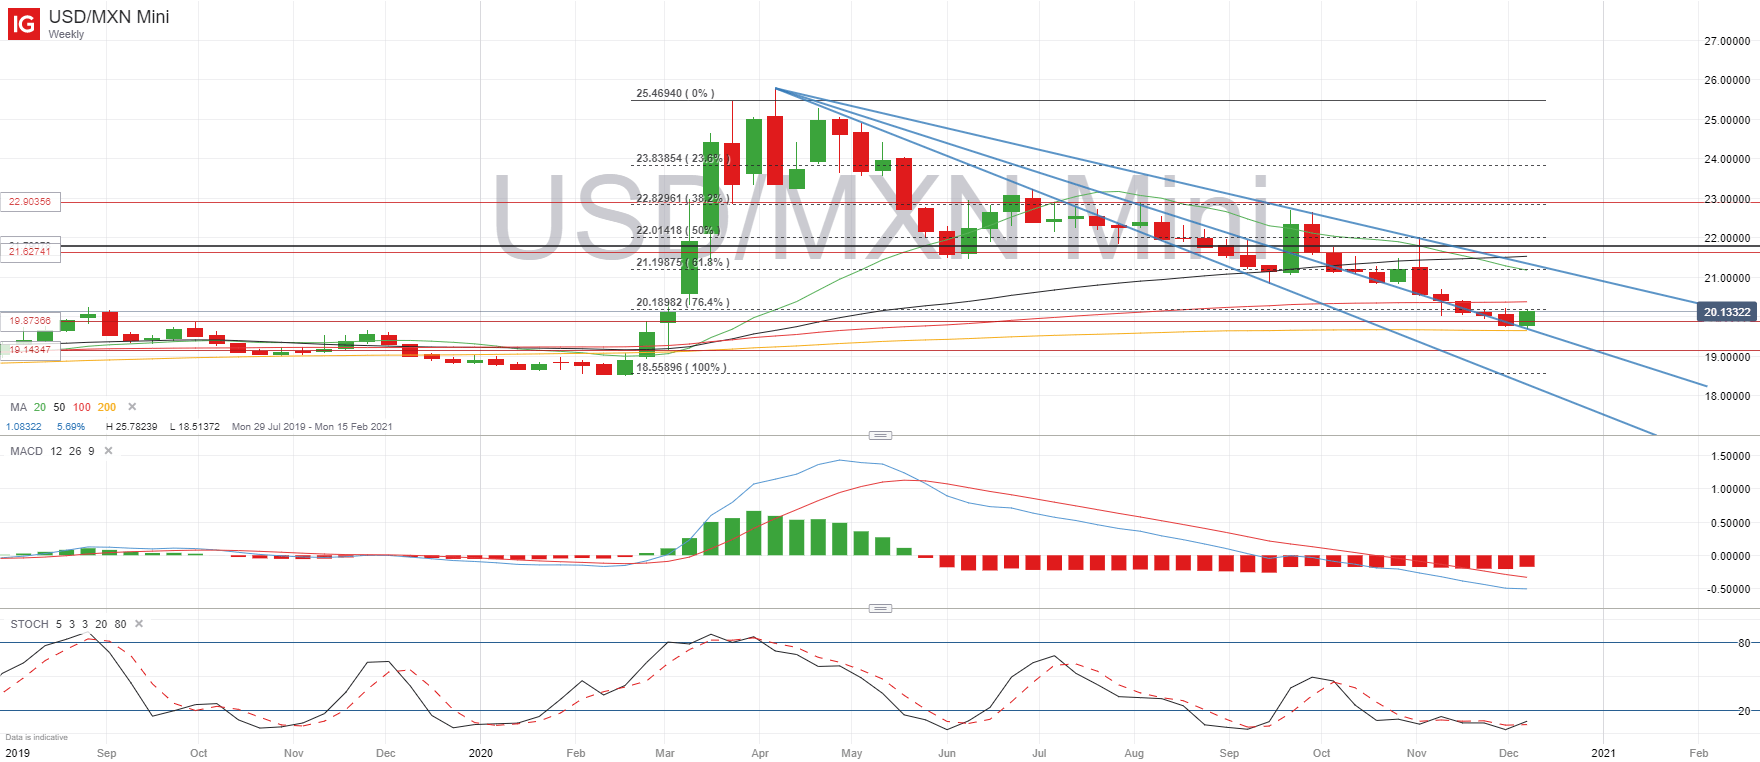
On the weekly chart, we can see there are three dominant trendlines that are shaping USD/MXN price action, which means the pair could be stuck between 19.70 and 21.10 before attempting to push towards 18.20, where the lower bound trendline is found. Also to note is that the weekly low is resting on the 200 SMA so further downside is going to need strong support from sellers to break the 19.69 area.
--- Written by Daniela Sabin Hathorn, Market Analyst
Follow Daniela on Twitter @HathornSabin


