


US Dollar Technical Price Outlook: DXY Weekly Trade Levels
- US Dollar technical trade level update – Weekly Chart
- USD attempting break of multi-year uptrend support
- DXY at risk for sharp declines sub-92.28- Initial weekly support 91.33
The US Dollar Index is off more than 0.60% this week with DXY attempting to break below major long-term uptrend support just above the yearly lows. The technical implications of this break are massive and suggest a significant shift in the longer-term USD price outlook. These are the updated technical targets and invalidation levels that matter on the US Dollar Index weekly price chart. Review my latest Strategy Webinar for an in-depth breakdown of this DXY technical setup and more.
US Dollar Index Price Chart – DXY Weekly
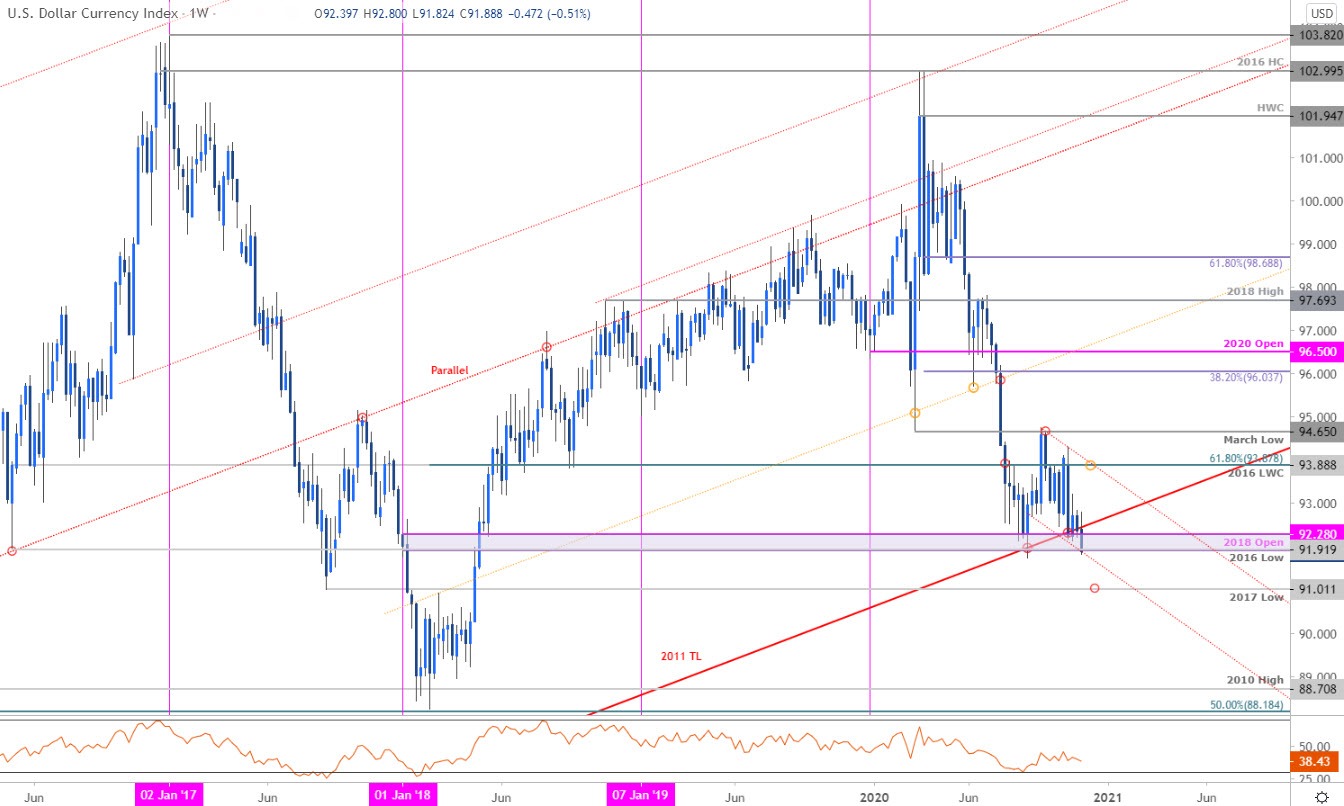
Chart Prepared by Michael Boutros, Technical Strategist; US Dollar Index on Tradingview
Notes: In my last US Dollar Weekly Price Outlook we noted that DXY was testing major support and to be on the lookout for, “topside exhaustion ahead of 93.92 on recoveries IF price is heading lower with a close below 91.92 needed to fuel the next leg.” The index continued to test key technical support at the 2016 low / 2018 objective yearly open at 91.92-92.28 for over three-weeks with price attempting to close below for the first time since April of 2018 on Friday.
A close below would risk accelerated losses for the index with the first major weekly support objective eyed at the 2017 low-week close at 91.33 and the 2017 low at 91.01- look for a more significant price reaction there IF reached. Initial weekly resistance now stands back at 92.28 backed by the 93-handle. Broader bearish invalidation now lowered to the 61.8% Fibonacci retracement off the 2018 advance / 2016 low-week close at 93.88
For a complete breakdown of Michael’s trading strategy, review his Foundations of Technical Analysis series on Building a Trading Strategy
Bottom line: The US Dollar attempting to break / close below critical support zone at multi-year uptrend support – risk for accelerated losses while below 92.28. From a trading standpoint, look for topside exhaustions ahead of the former 2011 trendline on recoveries IF price is indeed heading lower – a weekly close back this slope would threaten a false-break scenario. That said, watch for sharp declines while below this threshold with initial objectives eyed at the 2017 lows - keep in mind we’re heading into the close of the month- stay nimble here.

Key US Data Releases
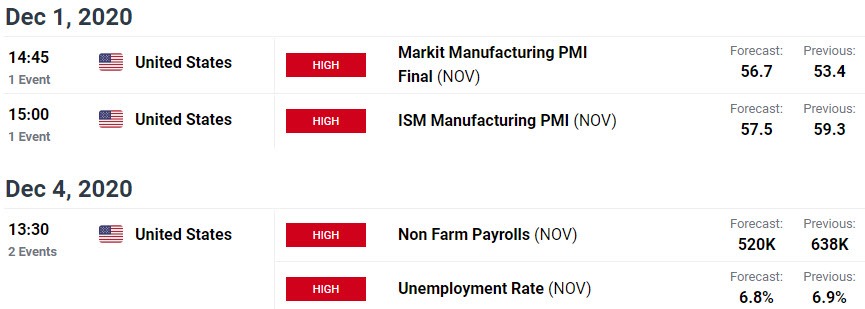
Economic Calendar - latest economic developments and upcoming event risk.
Previous Weekly Technical Charts
--- Written by Michael Boutros, Technical Strategist with DailyFX
Follow Michael on Twitter @MBForex


