


JPY WEEKLY TECHNICAL FORECAST NEUTRAL AS DOLLAR-YEN & AUSSIE-YEN DIVERGE
- Japanese Yen outlook turns neutral but still appears broadly constructive
- USD/JPY price action ripped higher last week and could extend its advance
- AUD/JPY faced aggressive selling pressure amid heightened market volatility
The Japanese Yen has appreciated sharply against top FX peers since the start of September. The move seems largely driven by an influx of risk aversion and heavy selling pressure across major stock indices. This abrupt downshift in trader sentiment put JPY price action back in favor seeing that the Yen is a top safe-haven currency that tends to rise during volatile market conditions.
JAPANESE YEN INDEX PRICE CHART: DAILY TIME FRAME (28 APR TO 25 SEP 2020)

Chart created by @RichDvorakFX with TradingView
Looking at an equally-weighted Japanese Yen Index comprised of USD/JPY, AUD/JPY, EUR/JPY, GBP/JPY, and CAD/JPY shows that Yen strength has wanedmore recently. For example, the Yen gaining ground against the Australian Dollar while weakening against the US Dollar highlights mixed JPY price action last week.

USD/JPY PRICE CHART WITH AUD/JPY OVERLAID: 2-HOUR TIME FRAME (31 AUG TO 25 SEP 2020)
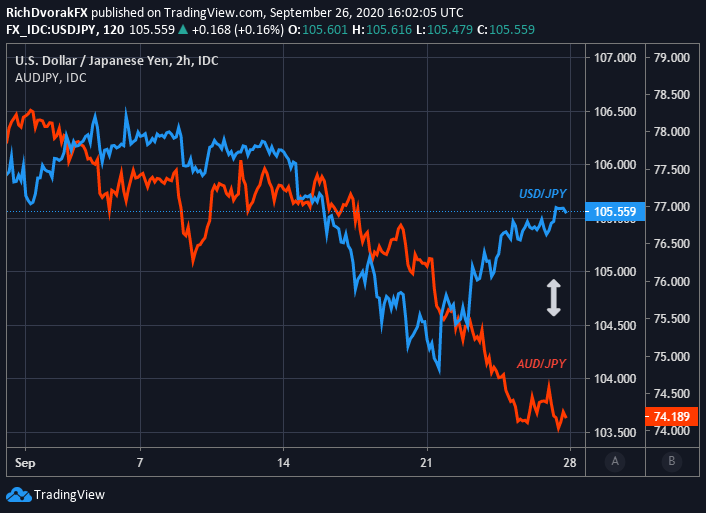
Chart created by @RichDvorakFX with TradingView
This caused the direction of USD/JPY and AUD/JPY to diverge from one another, which could continue going forward, particularly if volatility keeps spiking higher as markets swoon. That said, with month-end and quarter-end on deck this week, there is the potential risk that rebalancing flows unwind recent market activity.

USD/JPY PRICE CHART: DAILY TIME FRAME (25 JUN TO 25 SEP 2020)

USD/JPY price action ripped higher last week as the broader US Dollar builds upon its bullish reversal off multi-year lows. Reclaiming the 106.00-price level might open up the door for USD/JPY to extend its advance toward August swing highs near the 107.00-handle. On that note, the latest MACD crossover suggests upward momentum is gaining traction. However, failing to eclipse the 50-day moving average could send the Dollar-Yen snapping lower for a re-test of technical support underpinned by the 30 July and 20 September lows.
| Change in | Longs | Shorts | OI |
| Daily | -2% | 2% | 0% |
| Weekly | 12% | -16% | -6% |
AUD/JPY PRICE CHART: DAILY TIME FRAME (03 JUN TO 25 SEP 2020)

The steep stumble set forth by the Aussie-Yen this month has erased about three-quarters of the 600-pip rally from June to August. AUD/JPY price action now gravitates around the 76.4% Fibonacci retracement level of the aforementioned bullish leg, which stands out a potential area of support. A relief bounce could materialize off this level, perhaps fueled by an improvement in underlying market sentiment, though selling pressure may resume if spot AUD/JPY nears the 75.500-price. Nevertheless, taking out last week’s low, likely accompanied by a deeper move into ‘oversold’ territory as indicated by the relative strength index, could exacerbate AUD/JPY weakness and send spot prices plunging toward the mid-June swing lows.
| Change in | Longs | Shorts | OI |
| Daily | 0% | 11% | 5% |
| Weekly | 29% | -25% | -3% |
Keep Reading - AUD/USD Price Outlook: Australian Dollar Drops to Fresh Two-Month Low
-- Written by Rich Dvorak, Analyst for DailyFX.com
Connect with @RichDvorakFX on Twitter for real-time market insight


