


S&P 500 Index Technical Forecast: Bearish
- S&P 500 has paused its 5-month rally, moved into a consolidation phase
- Lower Bollinger Band serving as immediate chart support, capping losses
- Several large bearish candlesticks flag risk of near-term setbacks ahead
The S&P 500 index entered into a consolidation phase in early September, pausing a five-month bull rally. The VIX volatility index drifted lower in the past two weeks, suggesting this might be another healthy technical correction in a mid-term bull run. There could be more consolidations ahead however, as several technical indicators show.
The index entered the lower half of the Bollinger Band two weeks ago. Trading within the lower half of the Bollinger Band is usually perceived as bearish-biased. A firm break above the middle line of the band is needed to confirm a trendreversal.
The Bollinger Band indicator is composed of three lines. The middle line is simply the 20-Day Simple Moving Average (SMA). The upper band is calculated by adding two daily standard deviations onto the middle line. The lower band is calculated by subtracting from middle band by two daily standard deviations.
Statistically, the Bollinger Band infers a 95% likelihood (two standard deviations) that price movement will be contained within the upper and lower bounds. Bollinger Band traders usually assume that the price is likely continue to behave this way in the near future, unless under exceptional circumstances (like the Brexit referendum or a US presidential election).
A few large bearish candlesticks observed in September revealed sporadic selling pressure. Further consolidation may lead to a test of the 23.6% Fibonacci retracement level at 3,260. Even a 23.6% pullback seems like a mild, shallow correction in the mid-term horizon however.
S&P 500 Index – Daily Chart
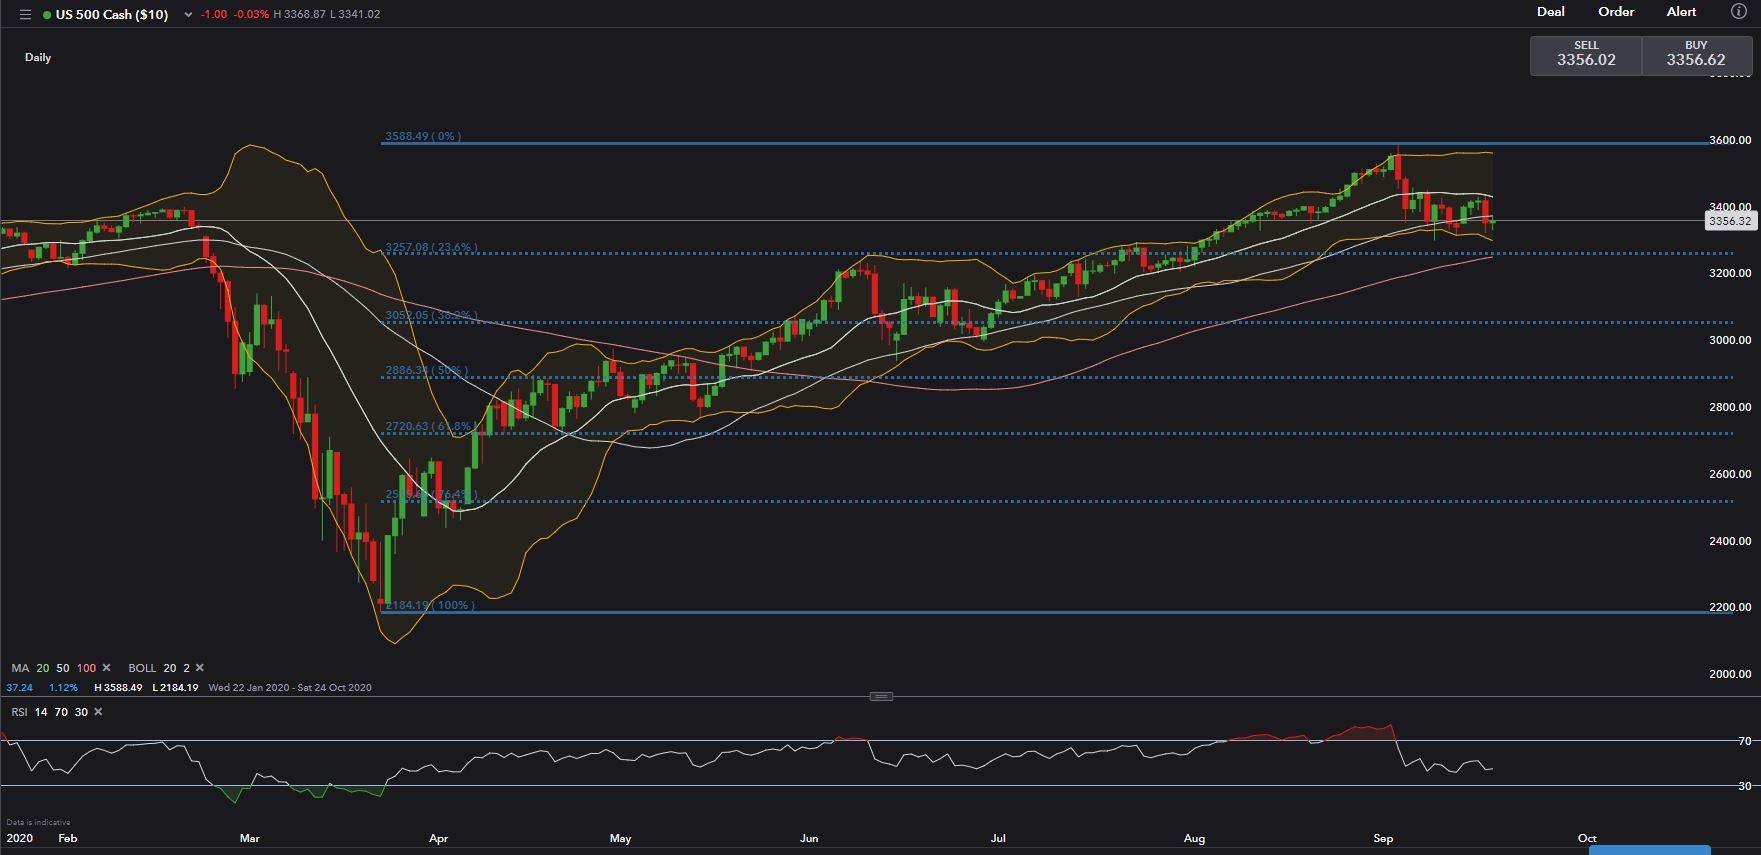
The RSI indicator retraced from overbought territory above 70.0, but it has not reached the oversold zone below 30.0 yet. The S&P 500 index might be correcting through time rather than through price, and thus traders who are holding a bullish view could opt for patience rather than capitulation, at least in the near term.
Immediate support levels can be found at 3,260 (23.6% Fibonacci retracement), followed by 3,200 (a psychological support). Immediate resistance levels can be found at 3,425 (20-Day SMA) and then 3,550 (upper Bollinger band).

--- Written by Margaret Yang, Strategist for DailyFX.com
To contact Margaret, use the Comments section below or @margaretyjy on Twitter


