


USD Technical Highlights:
- US Dollar Index (DXY) struggling to make good on bottoming pattern
- Big long-term support remains key to bigger picture outlook
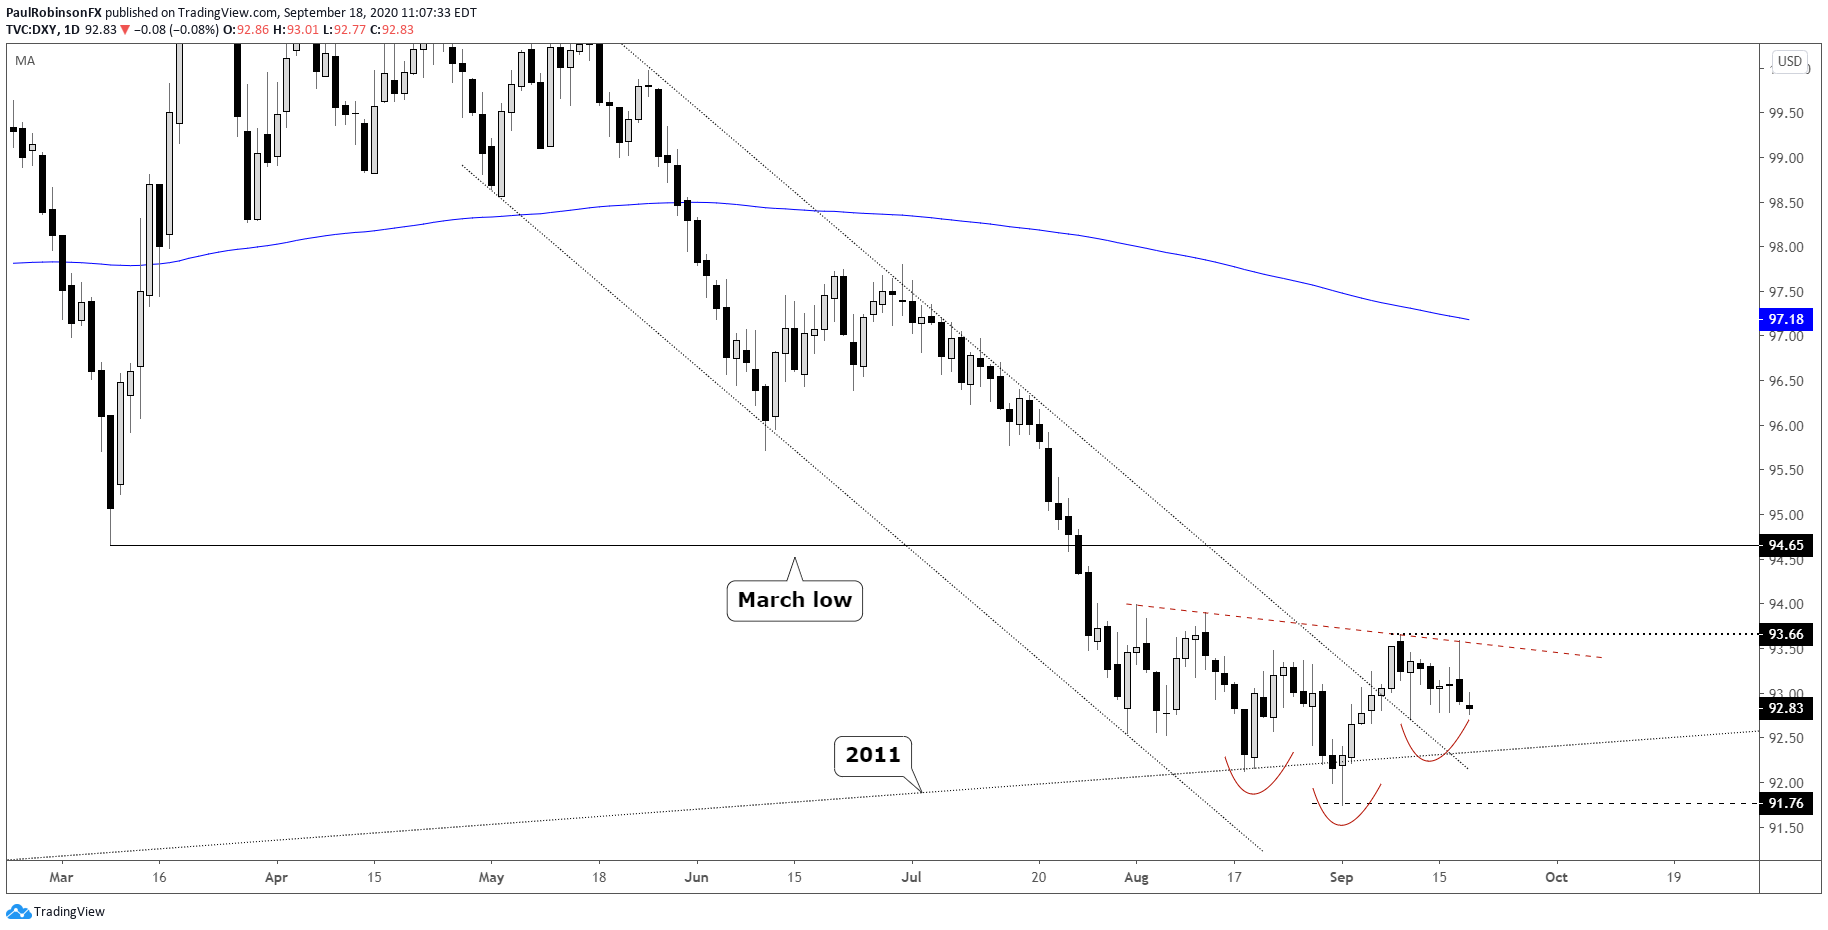
US Dollar Index (DXY) struggling to make good on bottoming pattern
The US Dollar Index (DXY) has a solid-looking bottoming pattern still in play via an inverse head-and-shoulders, but if price doesn’t break through the neckline soon then the formation could give-way to selling. To trigger the pattern a solid break of 93.66 is needed.
If a rally can break through then it should help drive USD higher to the March low at 94.65 or higher. However, if we see the right shoulder sag too much more, then risk turns towards sellers pressuring long-term support created by a level dating back to 1998 that is in confluence with a trend-line from 2011.
A break of 91.75 would give reason to believe that another extended leg lower is underway, with the 88-area targeted in that scenario.
In the week ahead we could learn a lot more about which way the DXY wants to trade, helping firm up a trading bias. It is of course entirely possible that choppy trading continues and neither of the above thresholds come into play. In this case, range/mean reversion traders will remain having the upper hand.

US Dollar Index (DXY) Weekly Chart (big support)

US Dollar Index (DXY) Daily Chart (yet to trigger bottoming pattern)
US Dollar Index (DXY) Chart by TradingView
Resources for Forex Traders
Whether you are a new or experienced trader, we have several resources available to help you; indicator for tracking trader sentiment, quarterly trading forecasts, analytical and educational webinars held daily, trading guides to help you improve trading performance, and one specifically for those who are new to forex.
---Written by Paul Robinson, Market Analyst
You can follow Paul on Twitter at @PaulRobinsonFX


