


NZD/USD Price, News and Analysis:
- Mixed technical signals and client sentiment data.
- NZ Q2 GDP and US FOMC will drive NZD/USD price action.
DailyFX Economic Data and Events Calendar
After hitting a 14-month high just under two weeks ago, NZD/USD has fallen sharply as global risk-on appetite cools. Increased rhetoric between the US and China and this week’s volatile tech market moves has taken the steam out of the New Zealand dollar after an impressive rally from mid-March. Next week’s Q2 GDP reading is expected to show that the New Zealand economy contracted by 12.8% q/q and 13.3% y/y and any deviation from these expectations is likely to move the pair. Earlier the same day (Wednesday Sept 17) the latest FOMC meeting is expected to keep all policy measures unchanged.
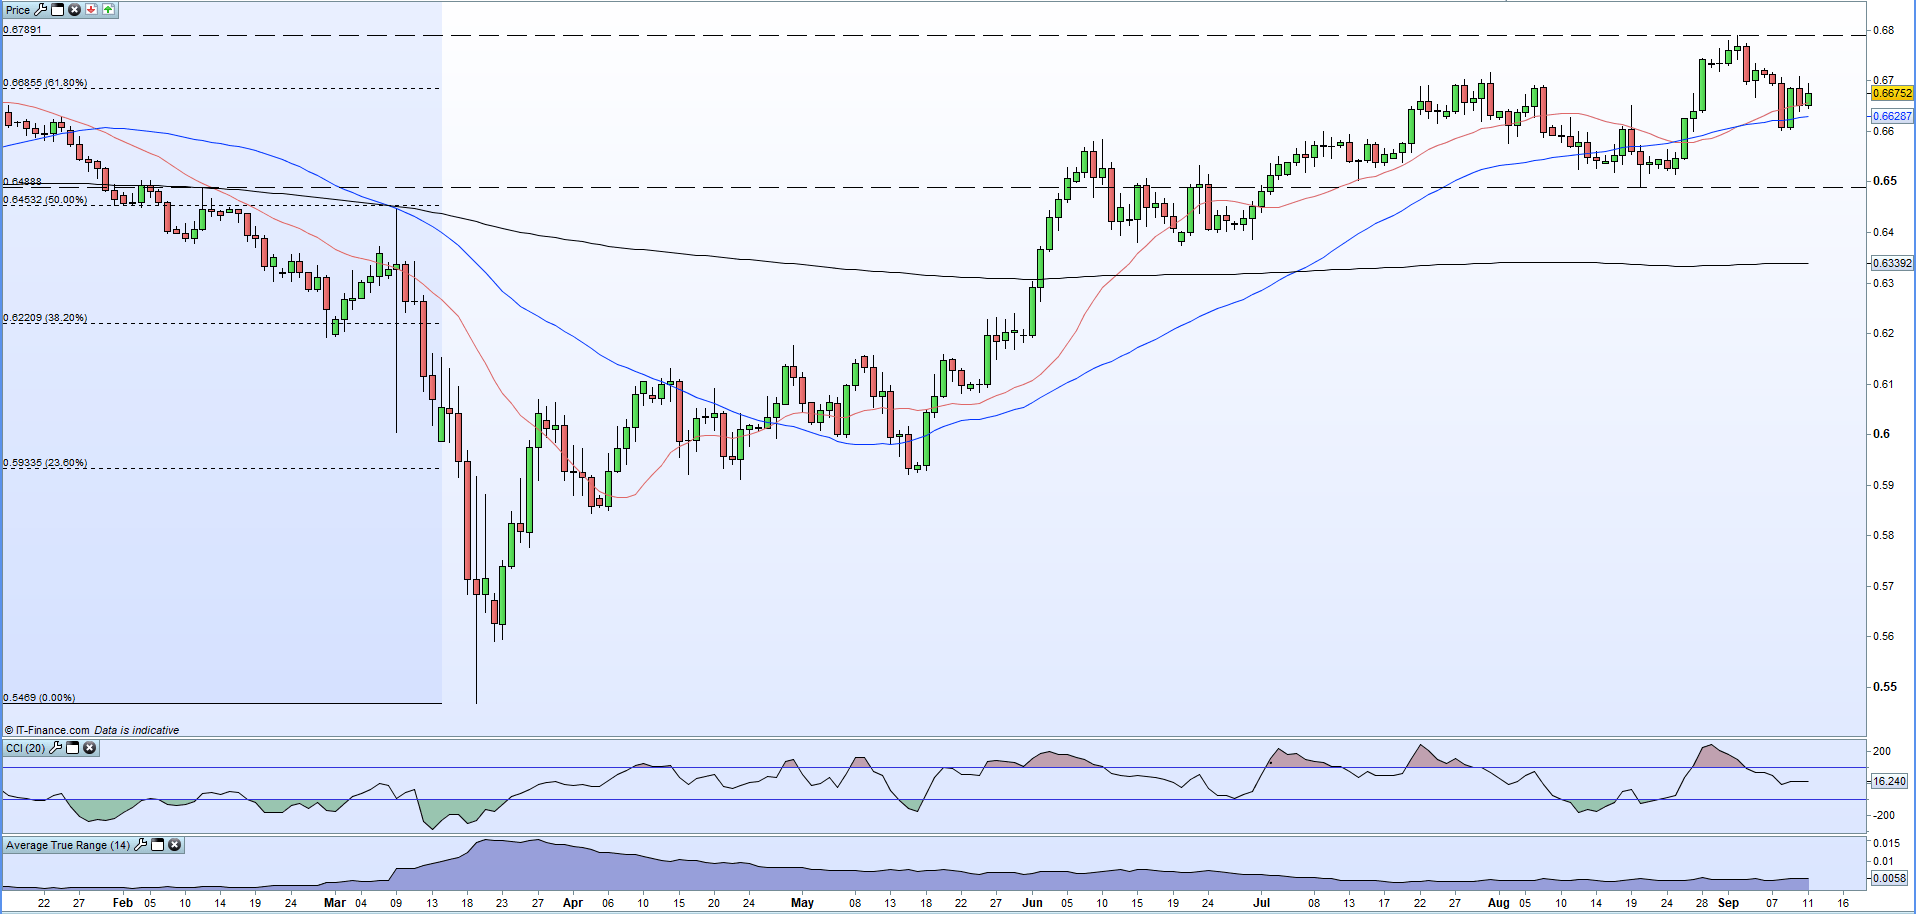
The daily chart is giving off mixed signals with short-term lower highs, a negative signal, ignoring the 20-day moving average moving through the 50-dma, a positive indicator. Client sentiment, see below, shows customers are short NZD/USD, a contrarian positive signal, but recent shifts in positioning warn of lower prices. The pair look likely to remain range bound between 0.6488 and 0.6781 and while both support and resistance are likely to hold moving ahead the lower end of the range may be tested first.
NZD/USD Daily Price Chart (January – September 11, 2020)
| Change in | Longs | Shorts | OI |
| Daily | 6% | -13% | 2% |
| Weekly | 40% | -35% | 15% |
IG retail trader data shows 36.97% of traders are net-long with the ratio of traders short to long at 1.71 to 1.The number of traders net-long is 3.98% lower than yesterday and 6.37% higher from last week, while the number of traders net-short is 20.94% lower than yesterday and 16.29% lower from last week.We typically take a contrarian view to crowd sentiment, and the fact traders are net-short suggests NZD/USD prices may continue to rise.
Yet traders are less net-short than yesterday and compared with last week. Recent changes in sentiment warn that the current NZD/USD price trend may soon reverse lower despite the fact traders remain net-short.
What is your view on NZD/USD – bullish or bearish?? You can let us know via the form at the end of this piece or you can contact the author via Twitter @nickcawley1.


