


Japanese Yen, USD/JPY, GBP/JPY, EUR/JPY, CAD/JPY - Talking Points
- USD/JPY eyeing Symmetrical Triangle chart pattern
- GBP/JPY may extend losses, will EUR/JPY follow?
- CAD/JPY focus may remain to the upside ahead
USD/JPY Outlook
The US Dollar continues to consolidate against the Japanese Yen. For some time, USD/JPY has been trading within a Symmetrical Triangle chart pattern. The direction of the breakout, be it higher or lower, could set the next trajectory for the pair. Key resistance sits above as a range between 106.86 and 107.05. Otherwise, a turn lower exposes the 105.10 – 105.30 zone.
USD/JPY Daily Chart
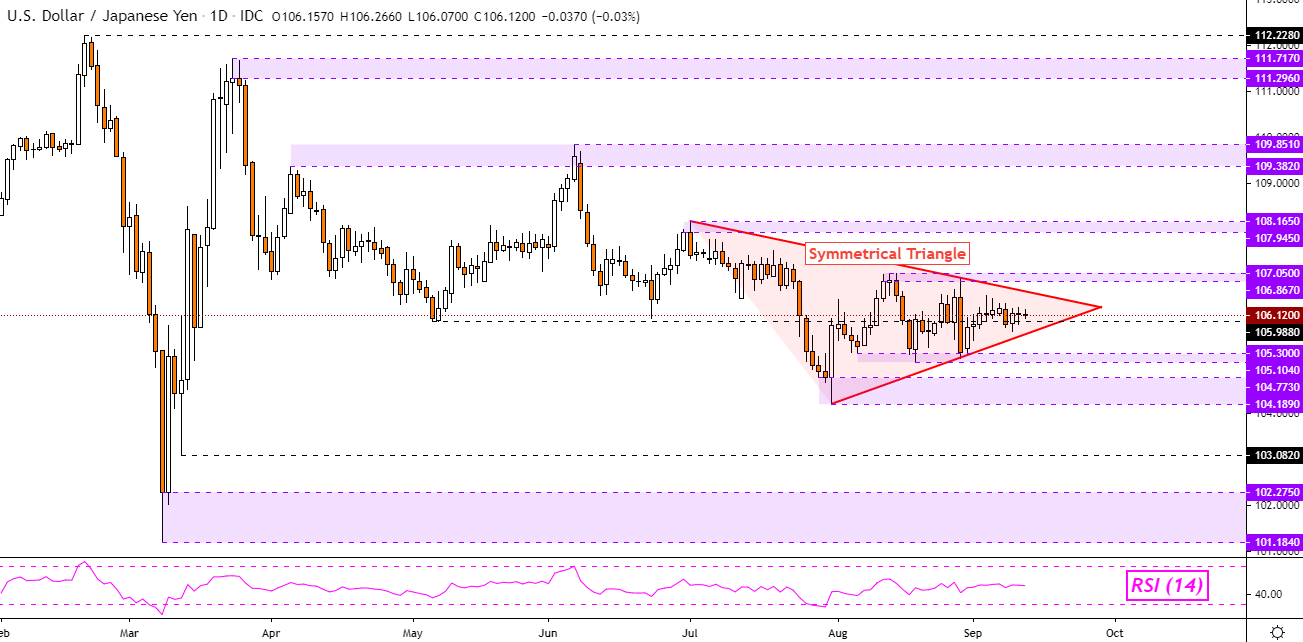
USD/JPY Chart Created in TradingView
GBP/JPY Outlook
The Japanese Yen could accelerate against the British Pound after GBP/JPY took out a combination of rising trend lines on the daily chart below. This followed a combination of bearish technical signals, such as a Shooting Star candlestick pattern and negative RSI divergence. The latter is a sign of fading upside momentum. Key support sits below as a range between 133.98 and 134.46. Beyond that exposes the 131.74 – 132.26 zone.
| Change in | Longs | Shorts | OI |
| Daily | 1% | -3% | -1% |
| Weekly | 13% | -31% | -17% |
GBP/JPYDaily Chart

GBP/JPY Chart Created in TradingView
EUR/JPY Outlook
The Japanese Yen is struggling to make further progress against the Euro after EUR/JPY closed under rising support from May. Since then, prices bounced just above the 50-day Simple Moving Average (SMA). However, the pair was unable to close back above the trend line, potentially establishing it as new resistance. A turn lower from here places the focus on the 124.29 – 124.43 support zone.

EUR/JPYDaily Chart

EUR/JPY Chart Created in TradingView
CAD/JPY Outlook
The Japanese Yen has lately been oscillating against the Canadian Dollar. A combination of the 50-day SMA and the 79.81 – 79.98 inflection zone acted as critical support this past week. Should prices fall under the latter two ahead, that could shift the CAD/JPY outlook increasingly bearish, exposing 78.91. Reestablishing the uptrend entails pushing above highs from June, exposing the 78.6% Fibonacci extension at 82.41.
CAD/JPY Daily Chart
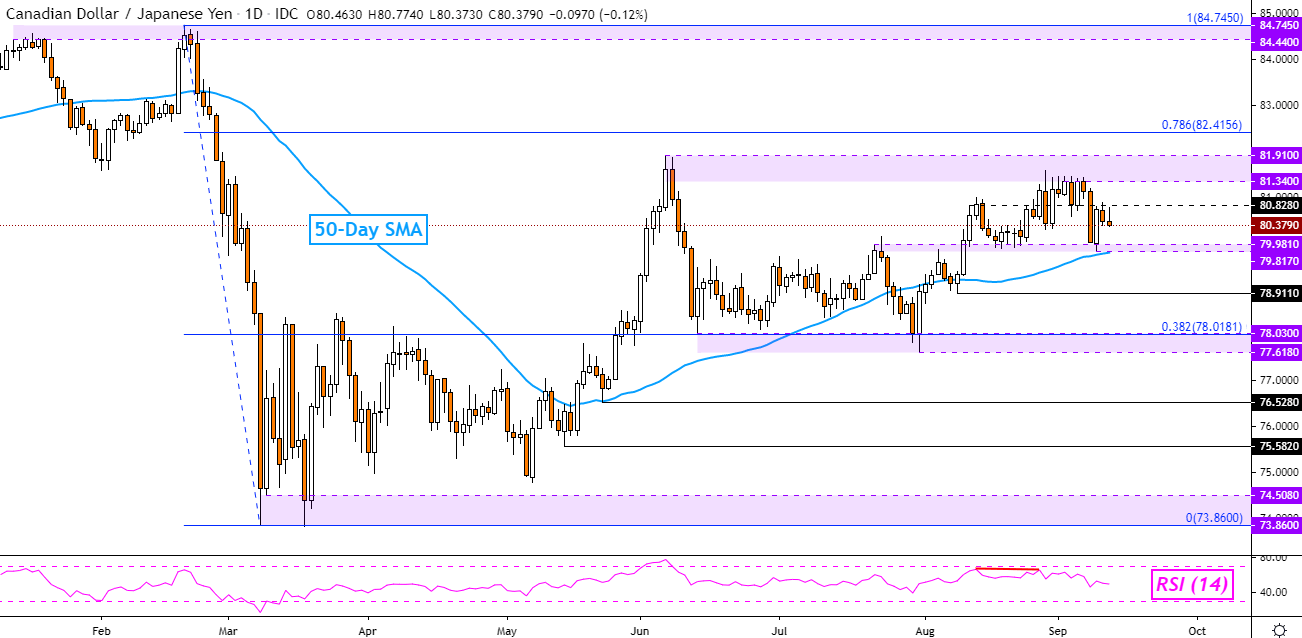
CAD/JPY Chart Created in TradingView
--- Written by Daniel Dubrovsky, Currency Analyst for DailyFX.com
To contact Daniel, use the comments section below or @ddubrovskyFX on Twitter


