USD Technical Highlights:
- US Dollar Index (DXY) is sitting on long-term support
- Dollar may be gearing up for another leg lower
US Dollar Index (DXY) is sitting on long-term support
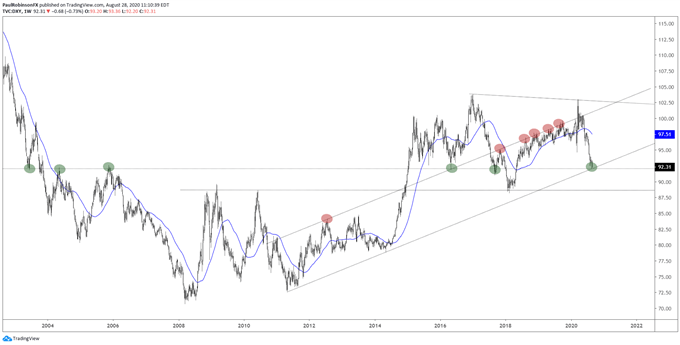
The US Dollar Index (DXY) is sitting on a crossroad of major long-term support extending as far back as 1998, and even though we are talking about a level that old it can still have significant impact on the near-term outlook.
The line running over from 1998 has at times been a very significant level, with its most recent inflection points occurring in 2016 and 2017. Coupled with this horizontal level of support is a trend-line from 2011 that is strengthened by the fact that a parallel of the same line was highly influential from 2017 to 2019.
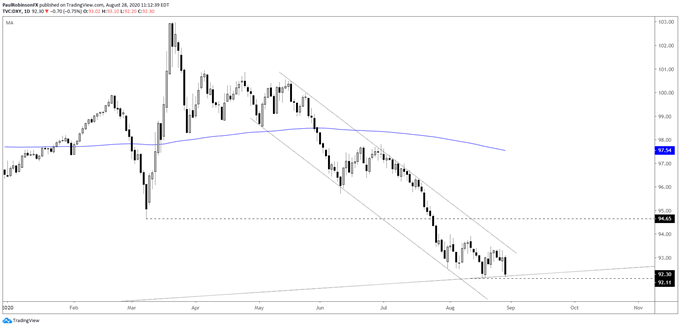
The intersection of support and resistance was initially rejected with a reversal bar taking shape on the week ending August 21, but as we saw last week that was only a temporary reprieve. Looking at the daily chart, the trend since the spring has been decisively down and in an orderly fashion.
The recent price action hasn’t offered up much as far as trades are concerned, but it is indicative of a trend that looks set to continue. With that, a breaking of long-term support looks to be in order and could quickly send the DXY down to the next major level, the 2018 low at 88.25.


US Dollar Index (DXY) Weekly Chart

US Dollar Index (DXY) Daily Chart ()

US Dollar Index (DXY) Chart by TradingView
Resources for Forex Traders
Whether you are a new or experienced trader, we have several resources available to help you; indicator for tracking trader sentiment, quarterly trading forecasts, analytical and educational webinars held daily, trading guides to help you improve trading performance, and one specifically for those who are new to forex.
---Written by Paul Robinson, Market Analyst
You can follow Paul on Twitter at @PaulRobinsonFX


