


Nasdaq 100, DAX 30, FTSE 100 Price Outlooks:
- The Nasdaq 100 has pressed higher, nearing the topside of its trading range as a result
- The DAX 30 and FTSE 100 also near the borders of their technical formations as volatility rises
- Difference between Dow, Nasdaq, and S&P 500: Major Facts & Opportunities
Nasdaq 100 Technical Forecast
Outlook: Neutral
The Nasdaq 100 established new levels again last week, extending its remarkable charge higher. After weeks of gains, the tech-heavy index has approached the topside of an ascending channel that has guided the Nasdaq 100 upward since early April. With overhead resistance nearby and lots of open air until support, the Nasdaq looks vulnerable to pullbacks from a technical perspective.
Nasdaq 100 Price Chart: 4 – Hour Time Frame (April 2020 – August 2020)

Similarly, a modest uptick in volatility last week following the Jackson Hole symposium may have been an early hint of what is to come in September when volatility historically rises. Further still, September is one of the worst performing months on average for the S&P 500, Dow Jones and Nasdaq. That said, consistently higher-highs leading to all-time highs is an indication bullish appetite remains widespread.
Stock Market Basics: A Beginner’s Guide to Trading Stocks
Consequently, it may be presumptuous to suggest outright weakness in the week ahead, but the technical standing of the index could allow for an attractive risk-reward opportunity if the ascending trading range looks to keep price contained.
To that end, I have a slightly bearish lean headed into next week as the tradeoff of risk and reward looks skewed to the downside in my opinion. Still, if any index can break out of technical boundaries and progress against headwinds, it is the Nasdaq – leading to a neutral forecast for the week ahead.
DAX 30 Technical Forecast
Outlook: Bullish
On the other end of the spectrum, is the DAX 30. While US indices have pressed higher with seemingly reckless abandon, the DAX 30 has been clinging to an ascending trendline as it looks for assistance on the journey higher. Unfortunately for bulls, barriers may exist on said route, with technical resistance threatening to turn price lower around 13,310.
DAX 30 Price Chart: 4 - Hour Time Frame (May 2020 – August 2020)
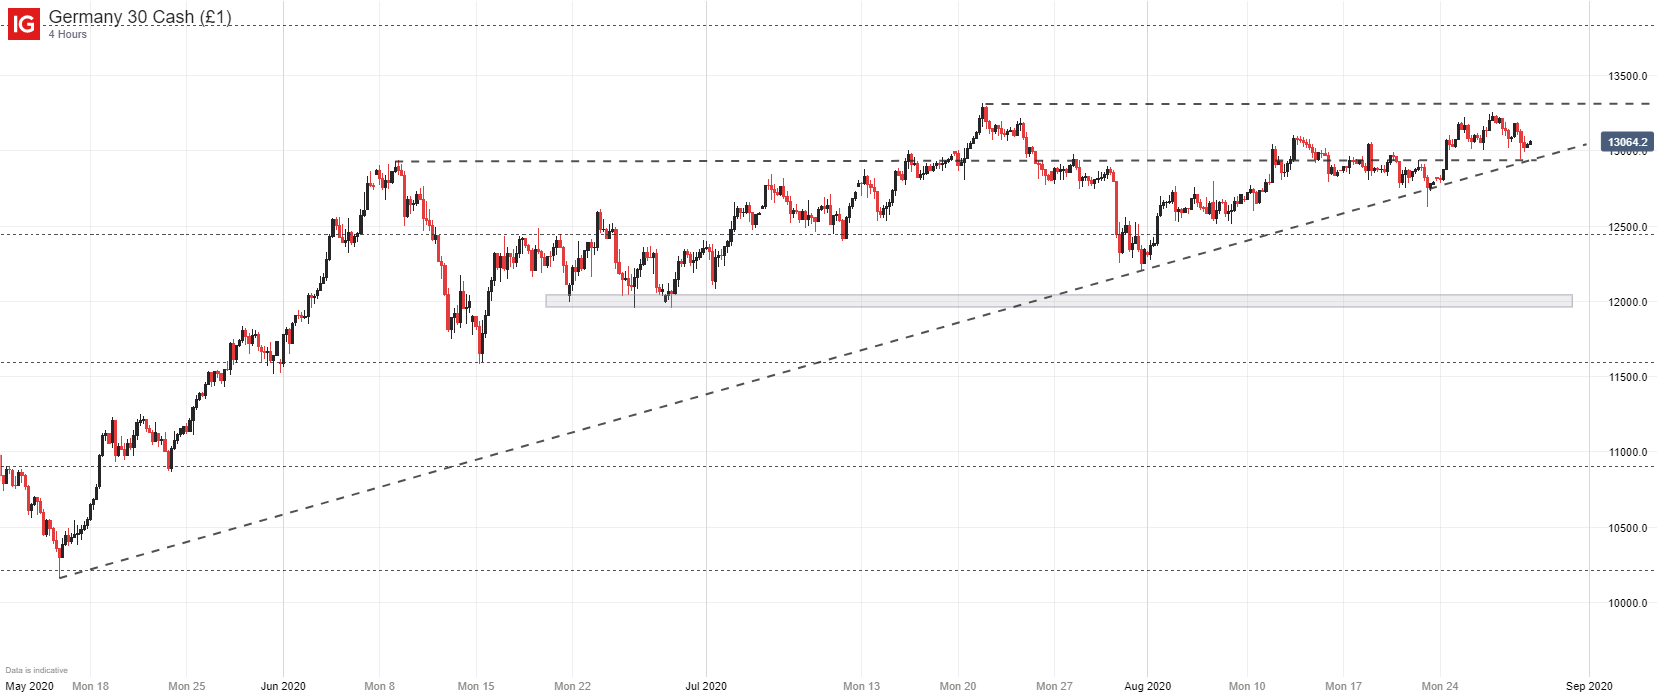
With a level narrowly beneath and slightly above its current trading price, the DAX 30 is running out of room in its current technical pattern. While seasonality has helped keep volatility muted, the arrival of September could allow for an honest break in either direction. Given that the longer-term trend over the last five months has been higher, I would typically favor a continuation higher at this stage.
FTSE 100 Technical Forecast
Outlook: Neutral
The FTSE 100 also nears an area of technical importance as it slips ever closer to a band of potential support near the 5,900 mark. If risk appetite continues in the week ahead, bullish opportunities may present themselves in the FTSE 100 as traders look to capitalize on a potential bounce off support.
FTSE 100 Price Chart: 4 – Hour Time Frame (May 2020 – August 2020)

Still, the trend over the last few months has been a gradual bleed lower for the FTSE 100 so I am not comfortable suggesting outright strength at this juncture. Similar to the Nasdaq 100, patience may be key when trading around these technical levels as a significant move in either direction could either confirm or eradicate an underlying bias.

Without confirmation, hoping prices will reverse at technical levels out of sheer respect for the area is akin to gambling. With that in mind, traders should keep a close eye on the technical levels outlined as an increase in volatility could see prices stage their long-awaited technical breaks. In the meantime, follow @PeterHanksFX on Twitter for updates and analysis.
--Written by Peter Hanks, Strategist for DailyFX.com


